Ecuadorian vs Immigrants from Eastern Africa Single Male Poverty
COMPARE
Ecuadorian
Immigrants from Eastern Africa
Single Male Poverty
Single Male Poverty Comparison
Ecuadorians
Immigrants from Eastern Africa
12.5%
SINGLE MALE POVERTY
85.9/ 100
METRIC RATING
128th/ 347
METRIC RANK
12.3%
SINGLE MALE POVERTY
95.0/ 100
METRIC RATING
108th/ 347
METRIC RANK
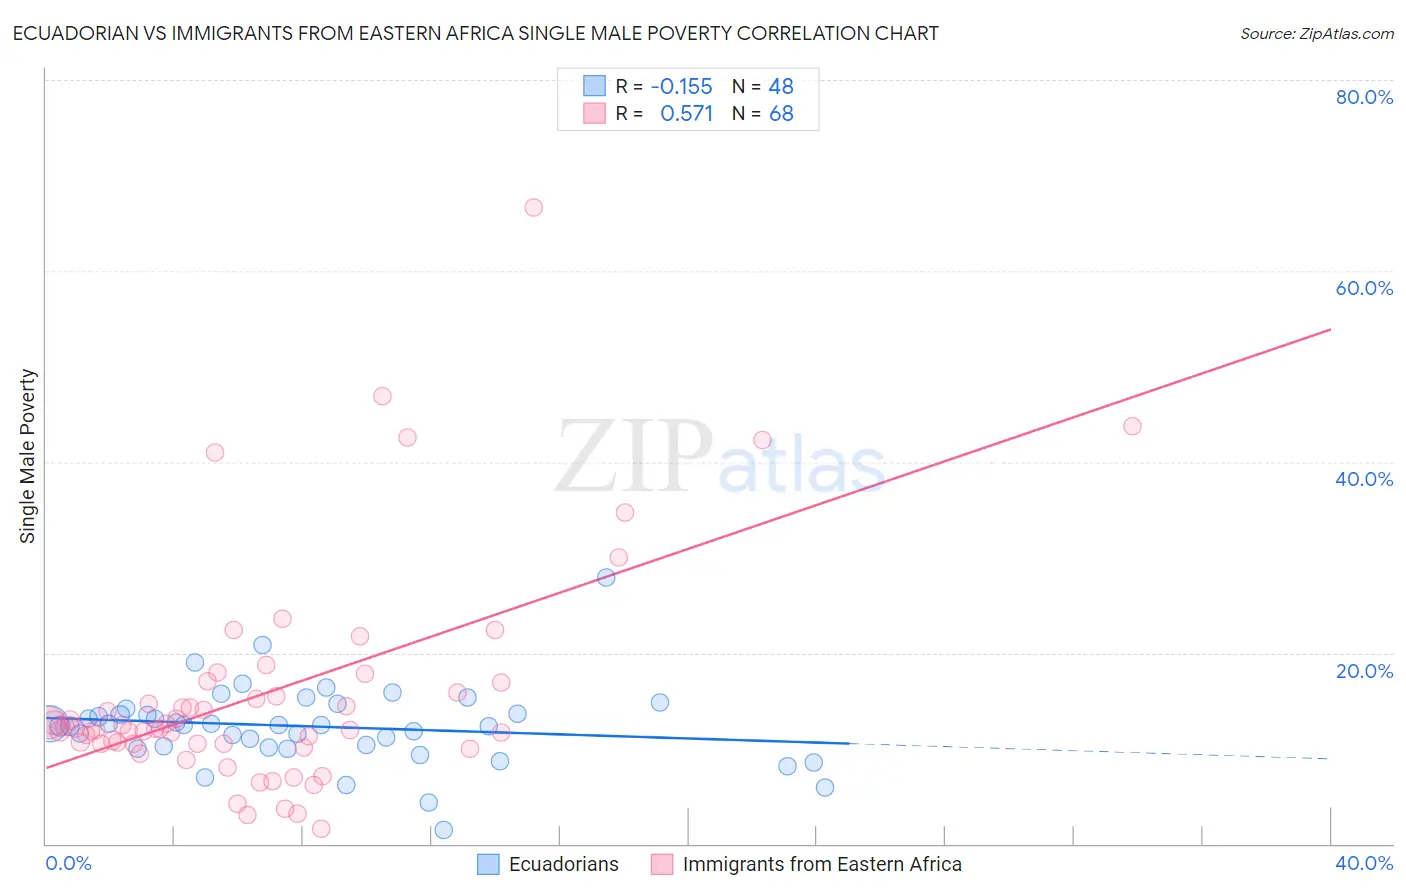
Ecuadorian vs Immigrants from Eastern Africa Single Male Poverty Correlation Chart
The statistical analysis conducted on geographies consisting of 286,561,230 people shows a poor negative correlation between the proportion of Ecuadorians and poverty level among single males in the United States with a correlation coefficient (R) of -0.155 and weighted average of 12.5%. Similarly, the statistical analysis conducted on geographies consisting of 319,633,400 people shows a substantial positive correlation between the proportion of Immigrants from Eastern Africa and poverty level among single males in the United States with a correlation coefficient (R) of 0.571 and weighted average of 12.3%, a difference of 1.6%.
Single Male Poverty Correlation Summary
| Measurement | Ecuadorian | Immigrants from Eastern Africa |
| Minimum | 1.5% | 1.5% |
| Maximum | 27.8% | 66.7% |
| Range | 26.3% | 65.1% |
| Mean | 12.3% | 15.7% |
| Median | 12.4% | 12.1% |
| Interquartile 25% (IQ1) | 10.1% | 10.5% |
| Interquartile 75% (IQ3) | 13.9% | 16.3% |
| Interquartile Range (IQR) | 3.8% | 5.9% |
| Standard Deviation (Sample) | 4.2% | 11.6% |
| Standard Deviation (Population) | 4.2% | 11.6% |
Demographics Similar to Ecuadorians and Immigrants from Eastern Africa by Single Male Poverty
In terms of single male poverty, the demographic groups most similar to Ecuadorians are Immigrants from Netherlands (12.5%, a difference of 0.040%), Romanian (12.5%, a difference of 0.050%), Immigrants from Jordan (12.5%, a difference of 0.14%), Russian (12.5%, a difference of 0.17%), and Immigrants from Kenya (12.5%, a difference of 0.20%). Similarly, the demographic groups most similar to Immigrants from Eastern Africa are Ugandan (12.3%, a difference of 0.13%), Immigrants from Portugal (12.3%, a difference of 0.36%), Immigrants from North Macedonia (12.3%, a difference of 0.36%), Kenyan (12.4%, a difference of 0.43%), and Pakistani (12.4%, a difference of 0.61%).
| Demographics | Rating | Rank | Single Male Poverty |
| Immigrants | Eastern Africa | 95.0 /100 | #108 | Exceptional 12.3% |
| Ugandans | 94.5 /100 | #109 | Exceptional 12.3% |
| Immigrants | Portugal | 93.6 /100 | #110 | Exceptional 12.3% |
| Immigrants | North Macedonia | 93.6 /100 | #111 | Exceptional 12.3% |
| Kenyans | 93.3 /100 | #112 | Exceptional 12.4% |
| Pakistanis | 92.4 /100 | #113 | Exceptional 12.4% |
| Nicaraguans | 92.1 /100 | #114 | Exceptional 12.4% |
| Immigrants | Southern Europe | 91.5 /100 | #115 | Exceptional 12.4% |
| Immigrants | Syria | 91.2 /100 | #116 | Exceptional 12.4% |
| Immigrants | Oceania | 91.1 /100 | #117 | Exceptional 12.4% |
| Albanians | 90.6 /100 | #118 | Exceptional 12.4% |
| Immigrants | Albania | 90.3 /100 | #119 | Exceptional 12.4% |
| Venezuelans | 89.4 /100 | #120 | Excellent 12.4% |
| Icelanders | 88.2 /100 | #121 | Excellent 12.5% |
| Serbians | 87.9 /100 | #122 | Excellent 12.5% |
| Immigrants | Kenya | 87.6 /100 | #123 | Excellent 12.5% |
| Russians | 87.3 /100 | #124 | Excellent 12.5% |
| Immigrants | Jordan | 87.1 /100 | #125 | Excellent 12.5% |
| Romanians | 86.4 /100 | #126 | Excellent 12.5% |
| Immigrants | Netherlands | 86.2 /100 | #127 | Excellent 12.5% |
| Ecuadorians | 85.9 /100 | #128 | Excellent 12.5% |