Ecuadorian vs Immigrants from Lebanon 7th Grade
COMPARE
Ecuadorian
Immigrants from Lebanon
7th Grade
7th Grade Comparison
Ecuadorians
Immigrants from Lebanon
94.0%
7TH GRADE
0.0/ 100
METRIC RATING
309th/ 347
METRIC RANK
95.8%
7TH GRADE
13.0/ 100
METRIC RATING
212th/ 347
METRIC RANK
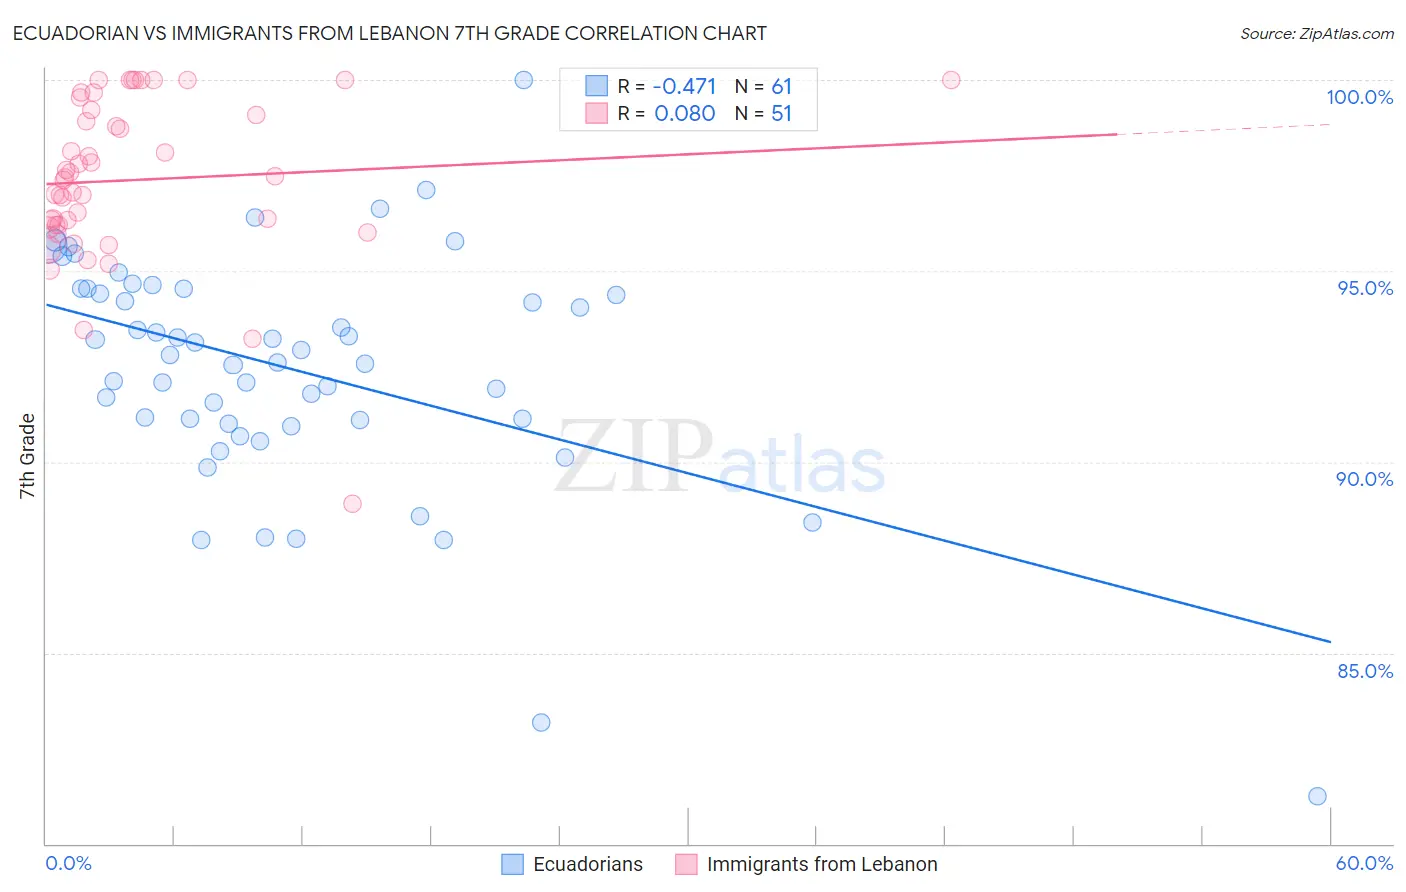
Ecuadorian vs Immigrants from Lebanon 7th Grade Correlation Chart
The statistical analysis conducted on geographies consisting of 317,753,005 people shows a moderate negative correlation between the proportion of Ecuadorians and percentage of population with at least 7th grade education in the United States with a correlation coefficient (R) of -0.471 and weighted average of 94.0%. Similarly, the statistical analysis conducted on geographies consisting of 217,083,357 people shows a slight positive correlation between the proportion of Immigrants from Lebanon and percentage of population with at least 7th grade education in the United States with a correlation coefficient (R) of 0.080 and weighted average of 95.8%, a difference of 1.8%.
7th Grade Correlation Summary
| Measurement | Ecuadorian | Immigrants from Lebanon |
| Minimum | 81.2% | 88.9% |
| Maximum | 100.0% | 100.0% |
| Range | 18.7% | 11.1% |
| Mean | 92.4% | 97.4% |
| Median | 92.8% | 97.4% |
| Interquartile 25% (IQ1) | 91.0% | 96.2% |
| Interquartile 75% (IQ3) | 94.5% | 99.2% |
| Interquartile Range (IQR) | 3.5% | 3.0% |
| Standard Deviation (Sample) | 3.1% | 2.2% |
| Standard Deviation (Population) | 3.1% | 2.1% |
Similar Demographics by 7th Grade
Demographics Similar to Ecuadorians by 7th Grade
In terms of 7th grade, the demographic groups most similar to Ecuadorians are Immigrants from Caribbean (94.0%, a difference of 0.010%), Puerto Rican (94.0%, a difference of 0.020%), Cape Verdean (94.1%, a difference of 0.060%), Immigrants (94.0%, a difference of 0.060%), and Immigrants from Bangladesh (94.0%, a difference of 0.070%).
| Demographics | Rating | Rank | 7th Grade |
| Immigrants | Laos | 0.0 /100 | #302 | Tragic 94.5% |
| Sri Lankans | 0.0 /100 | #303 | Tragic 94.4% |
| Immigrants | Haiti | 0.0 /100 | #304 | Tragic 94.3% |
| Guyanese | 0.0 /100 | #305 | Tragic 94.3% |
| Immigrants | Guyana | 0.0 /100 | #306 | Tragic 94.2% |
| Immigrants | Portugal | 0.0 /100 | #307 | Tragic 94.2% |
| Cape Verdeans | 0.0 /100 | #308 | Tragic 94.1% |
| Ecuadorians | 0.0 /100 | #309 | Tragic 94.0% |
| Immigrants | Caribbean | 0.0 /100 | #310 | Tragic 94.0% |
| Puerto Ricans | 0.0 /100 | #311 | Tragic 94.0% |
| Immigrants | Immigrants | 0.0 /100 | #312 | Tragic 94.0% |
| Immigrants | Bangladesh | 0.0 /100 | #313 | Tragic 94.0% |
| Japanese | 0.0 /100 | #314 | Tragic 94.0% |
| Vietnamese | 0.0 /100 | #315 | Tragic 93.9% |
| Immigrants | Vietnam | 0.0 /100 | #316 | Tragic 93.9% |
Demographics Similar to Immigrants from Lebanon by 7th Grade
In terms of 7th grade, the demographic groups most similar to Immigrants from Lebanon are Immigrants from Morocco (95.8%, a difference of 0.0%), Portuguese (95.8%, a difference of 0.010%), Bahamian (95.7%, a difference of 0.020%), Dutch West Indian (95.8%, a difference of 0.040%), and Hawaiian (95.8%, a difference of 0.040%).
| Demographics | Rating | Rank | 7th Grade |
| Moroccans | 18.9 /100 | #205 | Poor 95.8% |
| Africans | 17.6 /100 | #206 | Poor 95.8% |
| Navajo | 17.0 /100 | #207 | Poor 95.8% |
| Immigrants | Sudan | 17.0 /100 | #208 | Poor 95.8% |
| Dutch West Indians | 16.1 /100 | #209 | Poor 95.8% |
| Hawaiians | 16.0 /100 | #210 | Poor 95.8% |
| Portuguese | 13.6 /100 | #211 | Poor 95.8% |
| Immigrants | Lebanon | 13.0 /100 | #212 | Poor 95.8% |
| Immigrants | Morocco | 12.6 /100 | #213 | Poor 95.8% |
| Bahamians | 11.6 /100 | #214 | Poor 95.7% |
| Spanish Americans | 9.3 /100 | #215 | Tragic 95.7% |
| Immigrants | Chile | 9.1 /100 | #216 | Tragic 95.7% |
| Immigrants | Pakistan | 9.0 /100 | #217 | Tragic 95.7% |
| Immigrants | Liberia | 8.1 /100 | #218 | Tragic 95.7% |
| Immigrants | Southern Europe | 7.9 /100 | #219 | Tragic 95.7% |