Ecuadorian vs Immigrants from Chile 1st Grade
COMPARE
Ecuadorian
Immigrants from Chile
1st Grade
1st Grade Comparison
Ecuadorians
Immigrants from Chile
97.0%
1ST GRADE
0.0/ 100
METRIC RATING
305th/ 347
METRIC RANK
97.8%
1ST GRADE
17.7/ 100
METRIC RATING
205th/ 347
METRIC RANK
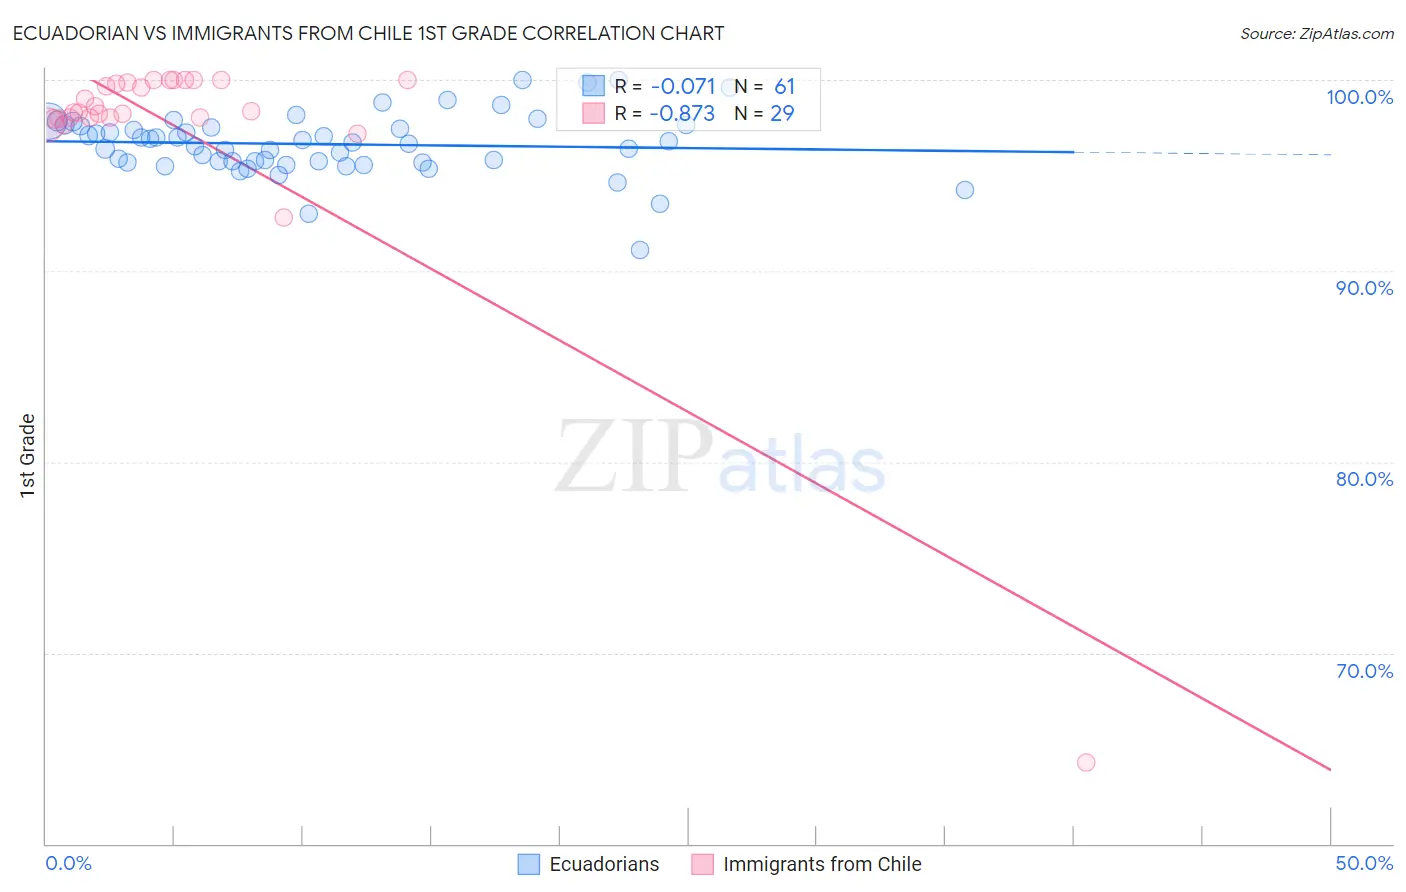
Ecuadorian vs Immigrants from Chile 1st Grade Correlation Chart
The statistical analysis conducted on geographies consisting of 317,865,723 people shows a slight negative correlation between the proportion of Ecuadorians and percentage of population with at least 1st grade education in the United States with a correlation coefficient (R) of -0.071 and weighted average of 97.0%. Similarly, the statistical analysis conducted on geographies consisting of 218,647,266 people shows a very strong negative correlation between the proportion of Immigrants from Chile and percentage of population with at least 1st grade education in the United States with a correlation coefficient (R) of -0.873 and weighted average of 97.8%, a difference of 0.83%.
1st Grade Correlation Summary
| Measurement | Ecuadorian | Immigrants from Chile |
| Minimum | 91.1% | 64.3% |
| Maximum | 100.0% | 100.0% |
| Range | 8.9% | 35.7% |
| Mean | 96.6% | 97.4% |
| Median | 96.7% | 98.3% |
| Interquartile 25% (IQ1) | 95.7% | 98.0% |
| Interquartile 75% (IQ3) | 97.6% | 99.9% |
| Interquartile Range (IQR) | 1.9% | 1.9% |
| Standard Deviation (Sample) | 1.6% | 6.5% |
| Standard Deviation (Population) | 1.6% | 6.4% |
Similar Demographics by 1st Grade
Demographics Similar to Ecuadorians by 1st Grade
In terms of 1st grade, the demographic groups most similar to Ecuadorians are Nicaraguan (97.0%, a difference of 0.0%), Somali (97.0%, a difference of 0.020%), Immigrants from Caribbean (97.0%, a difference of 0.050%), Belizean (96.9%, a difference of 0.060%), and Immigrants from Somalia (96.9%, a difference of 0.060%).
| Demographics | Rating | Rank | 1st Grade |
| Immigrants | Dominica | 0.0 /100 | #298 | Tragic 97.1% |
| Immigrants | Cuba | 0.0 /100 | #299 | Tragic 97.1% |
| Haitians | 0.0 /100 | #300 | Tragic 97.1% |
| Immigrants | South Eastern Asia | 0.0 /100 | #301 | Tragic 97.1% |
| Immigrants | Caribbean | 0.0 /100 | #302 | Tragic 97.0% |
| Somalis | 0.0 /100 | #303 | Tragic 97.0% |
| Nicaraguans | 0.0 /100 | #304 | Tragic 97.0% |
| Ecuadorians | 0.0 /100 | #305 | Tragic 97.0% |
| Belizeans | 0.0 /100 | #306 | Tragic 96.9% |
| Immigrants | Somalia | 0.0 /100 | #307 | Tragic 96.9% |
| Hispanics or Latinos | 0.0 /100 | #308 | Tragic 96.9% |
| Immigrants | Haiti | 0.0 /100 | #309 | Tragic 96.9% |
| Immigrants | Azores | 0.0 /100 | #310 | Tragic 96.9% |
| Sri Lankans | 0.0 /100 | #311 | Tragic 96.9% |
| Cape Verdeans | 0.0 /100 | #312 | Tragic 96.9% |
Demographics Similar to Immigrants from Chile by 1st Grade
In terms of 1st grade, the demographic groups most similar to Immigrants from Chile are Immigrants from Southern Europe (97.8%, a difference of 0.0%), Immigrants from Uganda (97.8%, a difference of 0.0%), Immigrants from Albania (97.8%, a difference of 0.0%), Immigrants from Lebanon (97.8%, a difference of 0.010%), and Immigrants from Ukraine (97.8%, a difference of 0.010%).
| Demographics | Rating | Rank | 1st Grade |
| Yuman | 24.4 /100 | #198 | Fair 97.8% |
| Tohono O'odham | 23.2 /100 | #199 | Fair 97.8% |
| Immigrants | Egypt | 22.6 /100 | #200 | Fair 97.8% |
| Immigrants | Lebanon | 20.1 /100 | #201 | Fair 97.8% |
| Immigrants | Ukraine | 19.2 /100 | #202 | Poor 97.8% |
| Immigrants | Southern Europe | 18.2 /100 | #203 | Poor 97.8% |
| Immigrants | Uganda | 18.2 /100 | #204 | Poor 97.8% |
| Immigrants | Chile | 17.7 /100 | #205 | Poor 97.8% |
| Immigrants | Albania | 17.3 /100 | #206 | Poor 97.8% |
| Africans | 16.5 /100 | #207 | Poor 97.8% |
| Immigrants | Northern Africa | 12.0 /100 | #208 | Poor 97.8% |
| Costa Ricans | 11.6 /100 | #209 | Poor 97.8% |
| Immigrants | Oceania | 11.0 /100 | #210 | Poor 97.8% |
| Laotians | 10.3 /100 | #211 | Poor 97.8% |
| Moroccans | 8.7 /100 | #212 | Tragic 97.7% |