Spanish American vs Houma Bachelor's Degree
COMPARE
Spanish American
Houma
Bachelor's Degree
Bachelor's Degree Comparison
Spanish Americans
Houma
33.1%
BACHELOR'S DEGREE
0.6/ 100
METRIC RATING
257th/ 347
METRIC RANK
21.4%
BACHELOR'S DEGREE
0.0/ 100
METRIC RATING
346th/ 347
METRIC RANK
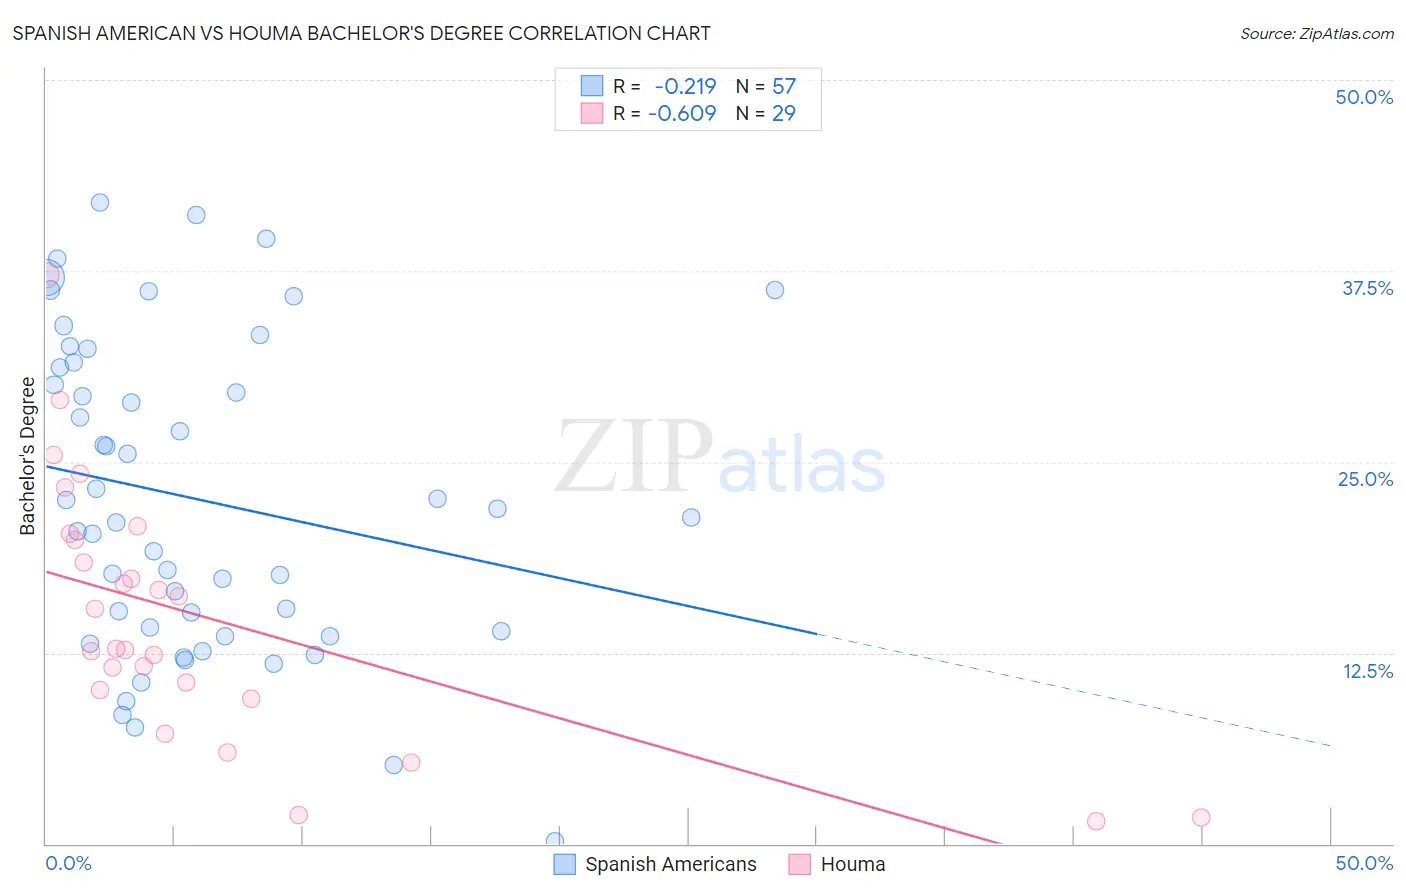
Spanish American vs Houma Bachelor's Degree Correlation Chart
The statistical analysis conducted on geographies consisting of 103,166,639 people shows a weak negative correlation between the proportion of Spanish Americans and percentage of population with at least bachelor's degree education in the United States with a correlation coefficient (R) of -0.219 and weighted average of 33.1%. Similarly, the statistical analysis conducted on geographies consisting of 36,792,534 people shows a significant negative correlation between the proportion of Houma and percentage of population with at least bachelor's degree education in the United States with a correlation coefficient (R) of -0.609 and weighted average of 21.4%, a difference of 54.3%.
Bachelor's Degree Correlation Summary
| Measurement | Spanish American | Houma |
| Minimum | 0.16% | 1.5% |
| Maximum | 41.9% | 37.2% |
| Range | 41.8% | 35.8% |
| Mean | 22.5% | 14.8% |
| Median | 21.3% | 12.8% |
| Interquartile 25% (IQ1) | 13.8% | 9.8% |
| Interquartile 75% (IQ3) | 31.3% | 20.1% |
| Interquartile Range (IQR) | 17.5% | 10.3% |
| Standard Deviation (Sample) | 10.2% | 8.4% |
| Standard Deviation (Population) | 10.2% | 8.2% |
Similar Demographics by Bachelor's Degree
Demographics Similar to Spanish Americans by Bachelor's Degree
In terms of bachelor's degree, the demographic groups most similar to Spanish Americans are French American Indian (33.1%, a difference of 0.040%), Osage (33.0%, a difference of 0.090%), Nicaraguan (33.1%, a difference of 0.22%), Iroquois (33.2%, a difference of 0.41%), and Native Hawaiian (33.2%, a difference of 0.43%).
| Demographics | Rating | Rank | Bachelor's Degree |
| Indonesians | 0.9 /100 | #250 | Tragic 33.5% |
| Japanese | 0.7 /100 | #251 | Tragic 33.3% |
| Immigrants | Bahamas | 0.7 /100 | #252 | Tragic 33.3% |
| U.S. Virgin Islanders | 0.7 /100 | #253 | Tragic 33.2% |
| Native Hawaiians | 0.7 /100 | #254 | Tragic 33.2% |
| Iroquois | 0.7 /100 | #255 | Tragic 33.2% |
| Nicaraguans | 0.6 /100 | #256 | Tragic 33.1% |
| Spanish Americans | 0.6 /100 | #257 | Tragic 33.1% |
| French American Indians | 0.6 /100 | #258 | Tragic 33.1% |
| Osage | 0.5 /100 | #259 | Tragic 33.0% |
| Malaysians | 0.5 /100 | #260 | Tragic 32.9% |
| Africans | 0.5 /100 | #261 | Tragic 32.9% |
| Immigrants | Jamaica | 0.5 /100 | #262 | Tragic 32.9% |
| Belizeans | 0.4 /100 | #263 | Tragic 32.8% |
| Central American Indians | 0.3 /100 | #264 | Tragic 32.5% |
Demographics Similar to Houma by Bachelor's Degree
In terms of bachelor's degree, the demographic groups most similar to Houma are Pima (23.2%, a difference of 8.3%), Navajo (23.6%, a difference of 10.2%), Yup'ik (19.4%, a difference of 10.4%), Tohono O'odham (24.4%, a difference of 14.0%), and Yakama (24.5%, a difference of 14.2%).
| Demographics | Rating | Rank | Bachelor's Degree |
| Mexicans | 0.0 /100 | #333 | Tragic 27.1% |
| Arapaho | 0.0 /100 | #334 | Tragic 26.6% |
| Natives/Alaskans | 0.0 /100 | #335 | Tragic 26.3% |
| Immigrants | Mexico | 0.0 /100 | #336 | Tragic 26.1% |
| Inupiat | 0.0 /100 | #337 | Tragic 25.8% |
| Pueblo | 0.0 /100 | #338 | Tragic 25.5% |
| Hopi | 0.0 /100 | #339 | Tragic 25.3% |
| Lumbee | 0.0 /100 | #340 | Tragic 24.8% |
| Yuman | 0.0 /100 | #341 | Tragic 24.5% |
| Yakama | 0.0 /100 | #342 | Tragic 24.5% |
| Tohono O'odham | 0.0 /100 | #343 | Tragic 24.4% |
| Navajo | 0.0 /100 | #344 | Tragic 23.6% |
| Pima | 0.0 /100 | #345 | Tragic 23.2% |
| Houma | 0.0 /100 | #346 | Tragic 21.4% |
| Yup'ik | 0.0 /100 | #347 | Tragic 19.4% |