Immigrants from Sri Lanka vs Houma Bachelor's Degree
COMPARE
Immigrants from Sri Lanka
Houma
Bachelor's Degree
Bachelor's Degree Comparison
Immigrants from Sri Lanka
Houma
46.1%
BACHELOR'S DEGREE
100.0/ 100
METRIC RATING
30th/ 347
METRIC RANK
21.4%
BACHELOR'S DEGREE
0.0/ 100
METRIC RATING
346th/ 347
METRIC RANK
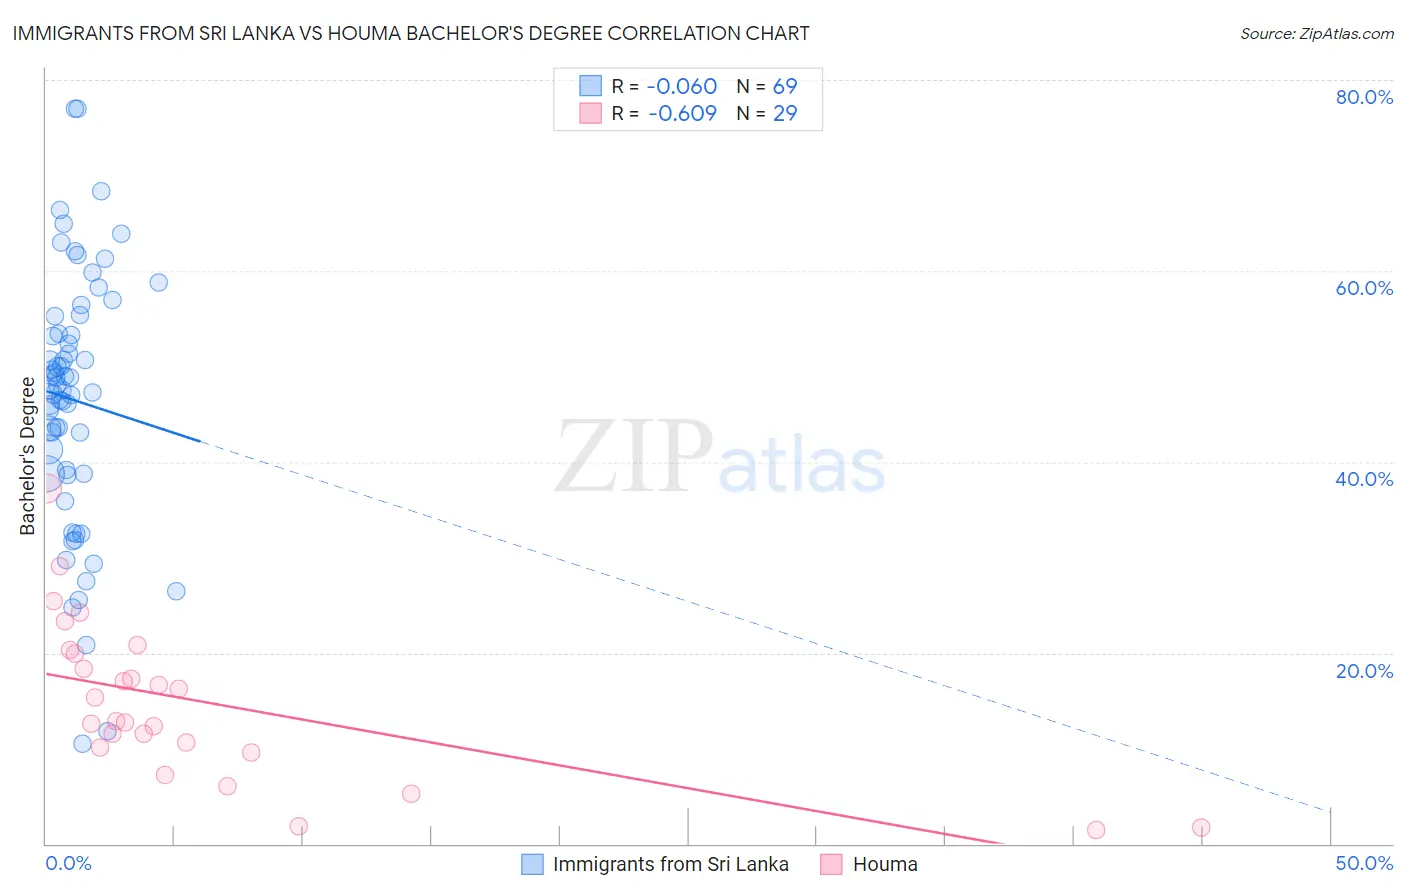
Immigrants from Sri Lanka vs Houma Bachelor's Degree Correlation Chart
The statistical analysis conducted on geographies consisting of 149,698,574 people shows a slight negative correlation between the proportion of Immigrants from Sri Lanka and percentage of population with at least bachelor's degree education in the United States with a correlation coefficient (R) of -0.060 and weighted average of 46.1%. Similarly, the statistical analysis conducted on geographies consisting of 36,792,534 people shows a significant negative correlation between the proportion of Houma and percentage of population with at least bachelor's degree education in the United States with a correlation coefficient (R) of -0.609 and weighted average of 21.4%, a difference of 115.2%.
Bachelor's Degree Correlation Summary
| Measurement | Immigrants from Sri Lanka | Houma |
| Minimum | 10.5% | 1.5% |
| Maximum | 77.0% | 37.2% |
| Range | 66.5% | 35.8% |
| Mean | 46.5% | 14.8% |
| Median | 47.6% | 12.8% |
| Interquartile 25% (IQ1) | 38.7% | 9.8% |
| Interquartile 75% (IQ3) | 54.4% | 20.1% |
| Interquartile Range (IQR) | 15.6% | 10.3% |
| Standard Deviation (Sample) | 13.5% | 8.4% |
| Standard Deviation (Population) | 13.4% | 8.2% |
Similar Demographics by Bachelor's Degree
Demographics Similar to Immigrants from Sri Lanka by Bachelor's Degree
In terms of bachelor's degree, the demographic groups most similar to Immigrants from Sri Lanka are Latvian (46.1%, a difference of 0.040%), Israeli (46.1%, a difference of 0.050%), Turkish (46.2%, a difference of 0.18%), Immigrants from Turkey (46.0%, a difference of 0.34%), and Immigrants from France (46.4%, a difference of 0.64%).
| Demographics | Rating | Rank | Bachelor's Degree |
| Immigrants | Sweden | 100.0 /100 | #23 | Exceptional 47.0% |
| Immigrants | Korea | 100.0 /100 | #24 | Exceptional 47.0% |
| Burmese | 100.0 /100 | #25 | Exceptional 46.9% |
| Immigrants | Japan | 100.0 /100 | #26 | Exceptional 46.8% |
| Immigrants | France | 100.0 /100 | #27 | Exceptional 46.4% |
| Turks | 100.0 /100 | #28 | Exceptional 46.2% |
| Israelis | 100.0 /100 | #29 | Exceptional 46.1% |
| Immigrants | Sri Lanka | 100.0 /100 | #30 | Exceptional 46.1% |
| Latvians | 100.0 /100 | #31 | Exceptional 46.1% |
| Immigrants | Turkey | 100.0 /100 | #32 | Exceptional 46.0% |
| Immigrants | Northern Europe | 100.0 /100 | #33 | Exceptional 45.6% |
| Immigrants | Denmark | 100.0 /100 | #34 | Exceptional 45.4% |
| Immigrants | Russia | 100.0 /100 | #35 | Exceptional 45.4% |
| Mongolians | 100.0 /100 | #36 | Exceptional 45.4% |
| Russians | 100.0 /100 | #37 | Exceptional 45.3% |
Demographics Similar to Houma by Bachelor's Degree
In terms of bachelor's degree, the demographic groups most similar to Houma are Pima (23.2%, a difference of 8.3%), Navajo (23.6%, a difference of 10.2%), Yup'ik (19.4%, a difference of 10.4%), Tohono O'odham (24.4%, a difference of 14.0%), and Yakama (24.5%, a difference of 14.2%).
| Demographics | Rating | Rank | Bachelor's Degree |
| Mexicans | 0.0 /100 | #333 | Tragic 27.1% |
| Arapaho | 0.0 /100 | #334 | Tragic 26.6% |
| Natives/Alaskans | 0.0 /100 | #335 | Tragic 26.3% |
| Immigrants | Mexico | 0.0 /100 | #336 | Tragic 26.1% |
| Inupiat | 0.0 /100 | #337 | Tragic 25.8% |
| Pueblo | 0.0 /100 | #338 | Tragic 25.5% |
| Hopi | 0.0 /100 | #339 | Tragic 25.3% |
| Lumbee | 0.0 /100 | #340 | Tragic 24.8% |
| Yuman | 0.0 /100 | #341 | Tragic 24.5% |
| Yakama | 0.0 /100 | #342 | Tragic 24.5% |
| Tohono O'odham | 0.0 /100 | #343 | Tragic 24.4% |
| Navajo | 0.0 /100 | #344 | Tragic 23.6% |
| Pima | 0.0 /100 | #345 | Tragic 23.2% |
| Houma | 0.0 /100 | #346 | Tragic 21.4% |
| Yup'ik | 0.0 /100 | #347 | Tragic 19.4% |