Dutch West Indian vs Guyanese 11th Grade
COMPARE
Dutch West Indian
Guyanese
11th Grade
11th Grade Comparison
Dutch West Indians
Guyanese
90.7%
11TH GRADE
0.0/ 100
METRIC RATING
281st/ 347
METRIC RANK
89.9%
11TH GRADE
0.0/ 100
METRIC RATING
301st/ 347
METRIC RANK
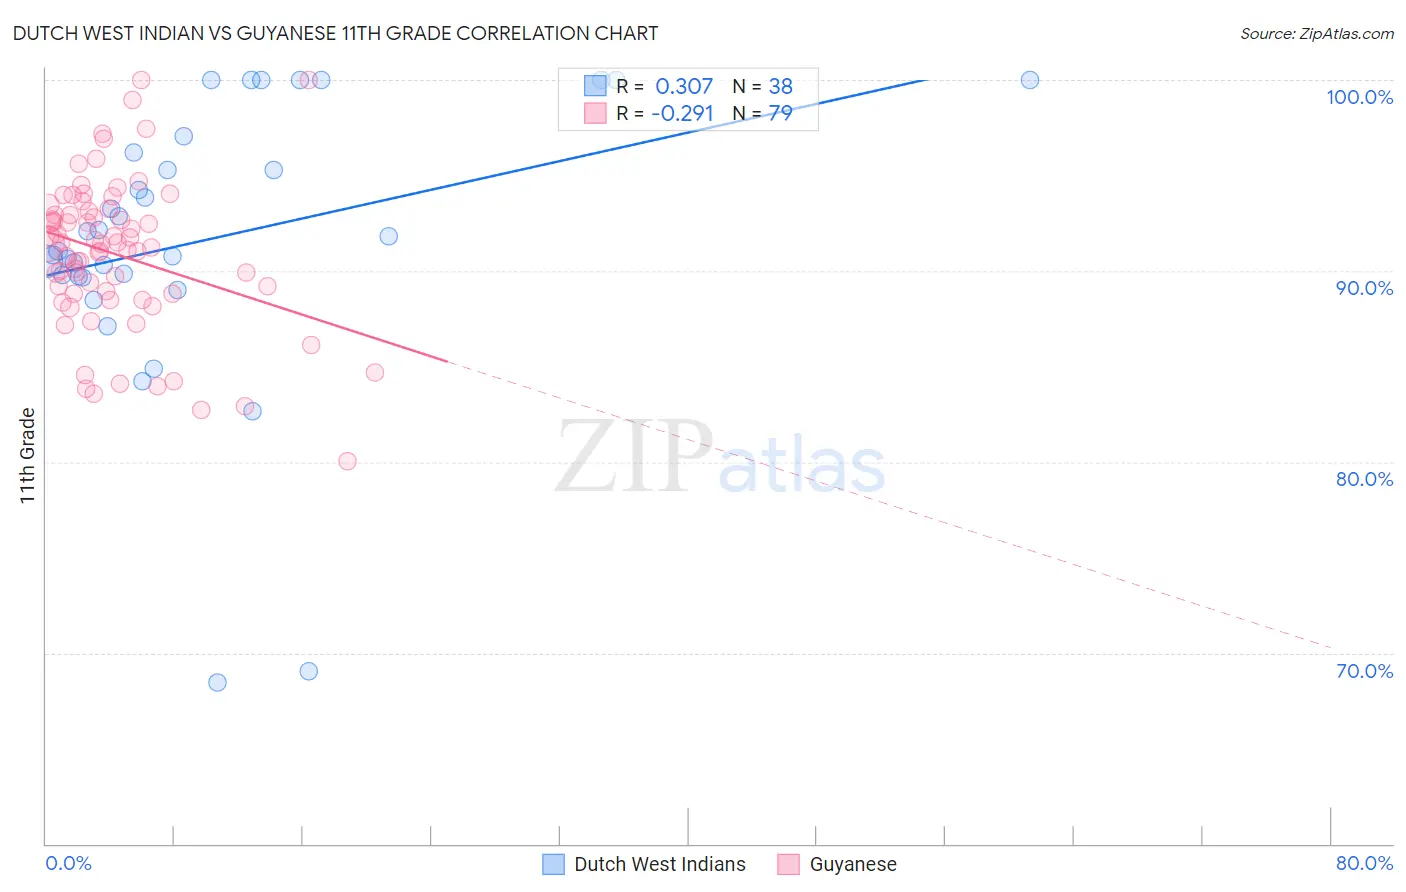
Dutch West Indian vs Guyanese 11th Grade Correlation Chart
The statistical analysis conducted on geographies consisting of 85,776,098 people shows a mild positive correlation between the proportion of Dutch West Indians and percentage of population with at least 11th grade education in the United States with a correlation coefficient (R) of 0.307 and weighted average of 90.7%. Similarly, the statistical analysis conducted on geographies consisting of 176,937,226 people shows a weak negative correlation between the proportion of Guyanese and percentage of population with at least 11th grade education in the United States with a correlation coefficient (R) of -0.291 and weighted average of 89.9%, a difference of 0.88%.
11th Grade Correlation Summary
| Measurement | Dutch West Indian | Guyanese |
| Minimum | 68.4% | 80.0% |
| Maximum | 100.0% | 100.0% |
| Range | 31.6% | 20.0% |
| Mean | 91.6% | 90.9% |
| Median | 91.4% | 91.4% |
| Interquartile 25% (IQ1) | 89.7% | 88.8% |
| Interquartile 75% (IQ3) | 96.2% | 93.2% |
| Interquartile Range (IQR) | 6.5% | 4.4% |
| Standard Deviation (Sample) | 7.2% | 4.0% |
| Standard Deviation (Population) | 7.1% | 4.0% |
Demographics Similar to Dutch West Indians and Guyanese by 11th Grade
In terms of 11th grade, the demographic groups most similar to Dutch West Indians are Immigrants from St. Vincent and the Grenadines (90.7%, a difference of 0.010%), Immigrants from Barbados (90.7%, a difference of 0.020%), Immigrants from Laos (90.5%, a difference of 0.19%), Immigrants from Burma/Myanmar (90.4%, a difference of 0.28%), and Immigrants from West Indies (90.4%, a difference of 0.33%). Similarly, the demographic groups most similar to Guyanese are Immigrants from Haiti (89.9%, a difference of 0.010%), Japanese (89.9%, a difference of 0.020%), Immigrants from Fiji (89.9%, a difference of 0.050%), Navajo (90.0%, a difference of 0.12%), and Fijian (90.0%, a difference of 0.16%).
| Demographics | Rating | Rank | 11th Grade |
| Dutch West Indians | 0.0 /100 | #281 | Tragic 90.7% |
| Immigrants | St. Vincent and the Grenadines | 0.0 /100 | #282 | Tragic 90.7% |
| Immigrants | Barbados | 0.0 /100 | #283 | Tragic 90.7% |
| Immigrants | Laos | 0.0 /100 | #284 | Tragic 90.5% |
| Immigrants | Burma/Myanmar | 0.0 /100 | #285 | Tragic 90.4% |
| Immigrants | West Indies | 0.0 /100 | #286 | Tragic 90.4% |
| Apache | 0.0 /100 | #287 | Tragic 90.4% |
| Pennsylvania Germans | 0.0 /100 | #288 | Tragic 90.3% |
| British West Indians | 0.0 /100 | #289 | Tragic 90.3% |
| Indonesians | 0.0 /100 | #290 | Tragic 90.3% |
| Haitians | 0.0 /100 | #291 | Tragic 90.3% |
| Cubans | 0.0 /100 | #292 | Tragic 90.2% |
| Natives/Alaskans | 0.0 /100 | #293 | Tragic 90.2% |
| Immigrants | Grenada | 0.0 /100 | #294 | Tragic 90.1% |
| Immigrants | Vietnam | 0.0 /100 | #295 | Tragic 90.0% |
| Fijians | 0.0 /100 | #296 | Tragic 90.0% |
| Navajo | 0.0 /100 | #297 | Tragic 90.0% |
| Immigrants | Fiji | 0.0 /100 | #298 | Tragic 89.9% |
| Japanese | 0.0 /100 | #299 | Tragic 89.9% |
| Immigrants | Haiti | 0.0 /100 | #300 | Tragic 89.9% |
| Guyanese | 0.0 /100 | #301 | Tragic 89.9% |