Dutch vs Immigrants from Sweden Unemployment Among Ages 30 to 34 years
COMPARE
Dutch
Immigrants from Sweden
Unemployment Among Ages 30 to 34 years
Unemployment Among Ages 30 to 34 years Comparison
Dutch
Immigrants from Sweden
5.5%
UNEMPLOYMENT AMONG AGES 30 TO 34 YEARS
52.6/ 100
METRIC RATING
170th/ 347
METRIC RANK
5.2%
UNEMPLOYMENT AMONG AGES 30 TO 34 YEARS
93.3/ 100
METRIC RATING
89th/ 347
METRIC RANK
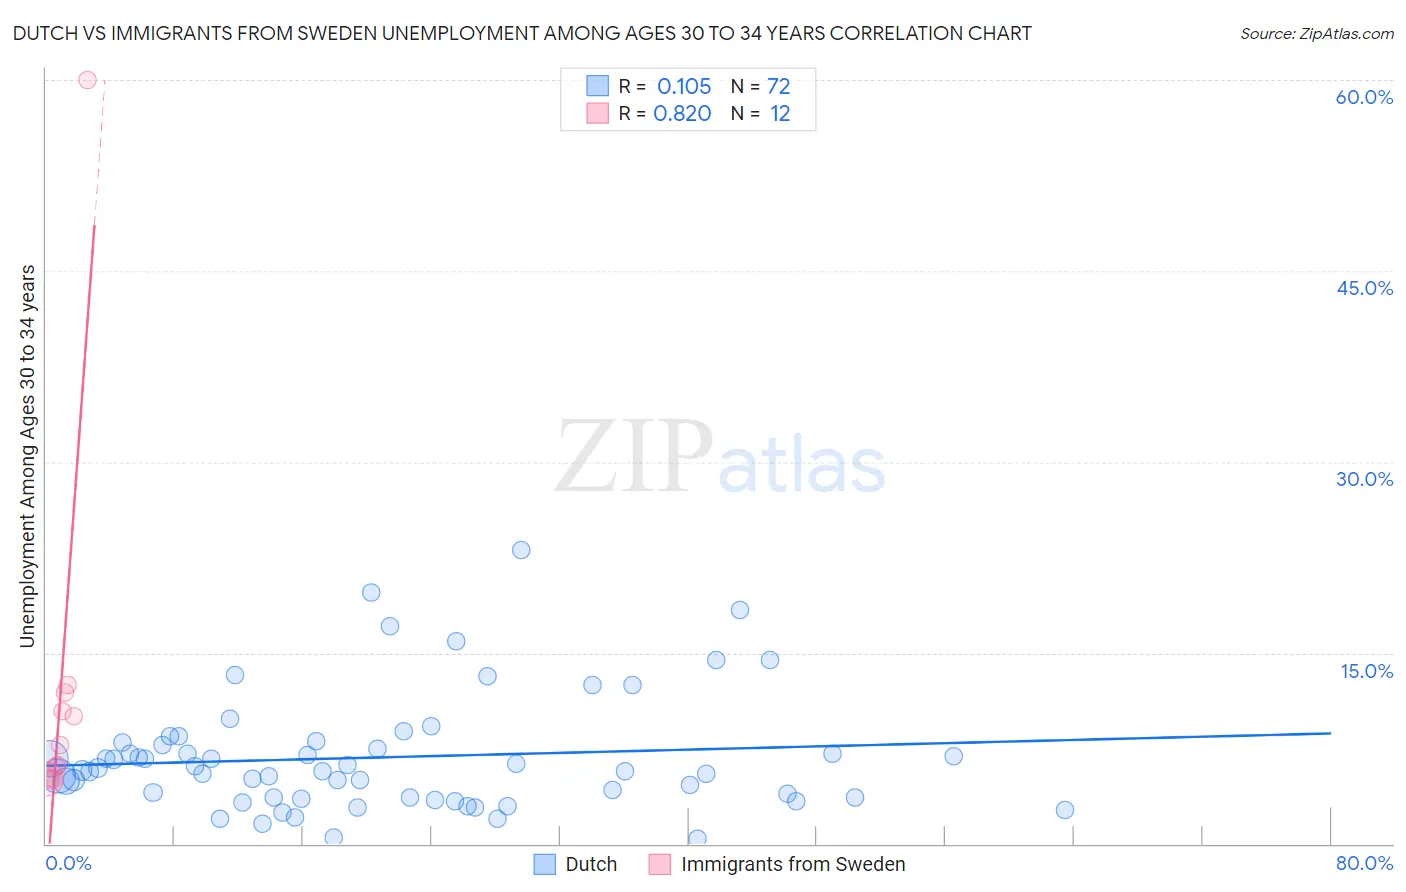
Dutch vs Immigrants from Sweden Unemployment Among Ages 30 to 34 years Correlation Chart
The statistical analysis conducted on geographies consisting of 486,869,178 people shows a poor positive correlation between the proportion of Dutch and unemployment rate among population between the ages 30 and 34 in the United States with a correlation coefficient (R) of 0.105 and weighted average of 5.5%. Similarly, the statistical analysis conducted on geographies consisting of 159,301,154 people shows a very strong positive correlation between the proportion of Immigrants from Sweden and unemployment rate among population between the ages 30 and 34 in the United States with a correlation coefficient (R) of 0.820 and weighted average of 5.2%, a difference of 4.6%.
Unemployment Among Ages 30 to 34 years Correlation Summary
| Measurement | Dutch | Immigrants from Sweden |
| Minimum | 0.41% | 5.1% |
| Maximum | 23.1% | 60.0% |
| Range | 22.7% | 54.9% |
| Mean | 6.8% | 12.1% |
| Median | 5.7% | 7.0% |
| Interquartile 25% (IQ1) | 3.6% | 5.1% |
| Interquartile 75% (IQ3) | 7.9% | 11.2% |
| Interquartile Range (IQR) | 4.3% | 6.0% |
| Standard Deviation (Sample) | 4.5% | 15.3% |
| Standard Deviation (Population) | 4.5% | 14.7% |
Similar Demographics by Unemployment Among Ages 30 to 34 years
Demographics Similar to Dutch by Unemployment Among Ages 30 to 34 years
In terms of unemployment among ages 30 to 34 years, the demographic groups most similar to Dutch are South American (5.4%, a difference of 0.020%), Immigrants from Israel (5.4%, a difference of 0.020%), Scottish (5.5%, a difference of 0.060%), Immigrants from Austria (5.5%, a difference of 0.090%), and English (5.4%, a difference of 0.15%).
| Demographics | Rating | Rank | Unemployment Among Ages 30 to 34 years |
| Arabs | 57.7 /100 | #163 | Average 5.4% |
| Basques | 57.3 /100 | #164 | Average 5.4% |
| Welsh | 56.3 /100 | #165 | Average 5.4% |
| Immigrants | Thailand | 55.6 /100 | #166 | Average 5.4% |
| English | 54.8 /100 | #167 | Average 5.4% |
| South Americans | 52.9 /100 | #168 | Average 5.4% |
| Immigrants | Israel | 52.9 /100 | #169 | Average 5.4% |
| Dutch | 52.6 /100 | #170 | Average 5.5% |
| Scottish | 51.8 /100 | #171 | Average 5.5% |
| Immigrants | Austria | 51.3 /100 | #172 | Average 5.5% |
| Peruvians | 50.2 /100 | #173 | Average 5.5% |
| Immigrants | Laos | 50.0 /100 | #174 | Average 5.5% |
| Afghans | 49.6 /100 | #175 | Average 5.5% |
| Immigrants | Peru | 48.0 /100 | #176 | Average 5.5% |
| Immigrants | Ukraine | 47.7 /100 | #177 | Average 5.5% |
Demographics Similar to Immigrants from Sweden by Unemployment Among Ages 30 to 34 years
In terms of unemployment among ages 30 to 34 years, the demographic groups most similar to Immigrants from Sweden are Immigrants from Kenya (5.2%, a difference of 0.010%), Immigrants from Australia (5.2%, a difference of 0.050%), Bhutanese (5.2%, a difference of 0.050%), Immigrants from Romania (5.2%, a difference of 0.14%), and Immigrants from Egypt (5.2%, a difference of 0.17%).
| Demographics | Rating | Rank | Unemployment Among Ages 30 to 34 years |
| Immigrants | Latvia | 94.2 /100 | #82 | Exceptional 5.2% |
| Immigrants | Korea | 94.1 /100 | #83 | Exceptional 5.2% |
| Immigrants | Uganda | 94.0 /100 | #84 | Exceptional 5.2% |
| Immigrants | Egypt | 93.9 /100 | #85 | Exceptional 5.2% |
| Immigrants | Australia | 93.5 /100 | #86 | Exceptional 5.2% |
| Bhutanese | 93.5 /100 | #87 | Exceptional 5.2% |
| Immigrants | Kenya | 93.3 /100 | #88 | Exceptional 5.2% |
| Immigrants | Sweden | 93.3 /100 | #89 | Exceptional 5.2% |
| Immigrants | Romania | 92.8 /100 | #90 | Exceptional 5.2% |
| Iraqis | 92.6 /100 | #91 | Exceptional 5.2% |
| Immigrants | Argentina | 92.5 /100 | #92 | Exceptional 5.2% |
| Laotians | 92.4 /100 | #93 | Exceptional 5.2% |
| Maltese | 92.3 /100 | #94 | Exceptional 5.2% |
| Kenyans | 92.1 /100 | #95 | Exceptional 5.2% |
| Mongolians | 91.7 /100 | #96 | Exceptional 5.2% |