Dominican vs Immigrants from Moldova Nursery School
COMPARE
Dominican
Immigrants from Moldova
Nursery School
Nursery School Comparison
Dominicans
Immigrants from Moldova
96.8%
NURSERY SCHOOL
0.0/ 100
METRIC RATING
325th/ 347
METRIC RANK
98.0%
NURSERY SCHOOL
69.6/ 100
METRIC RATING
153rd/ 347
METRIC RANK
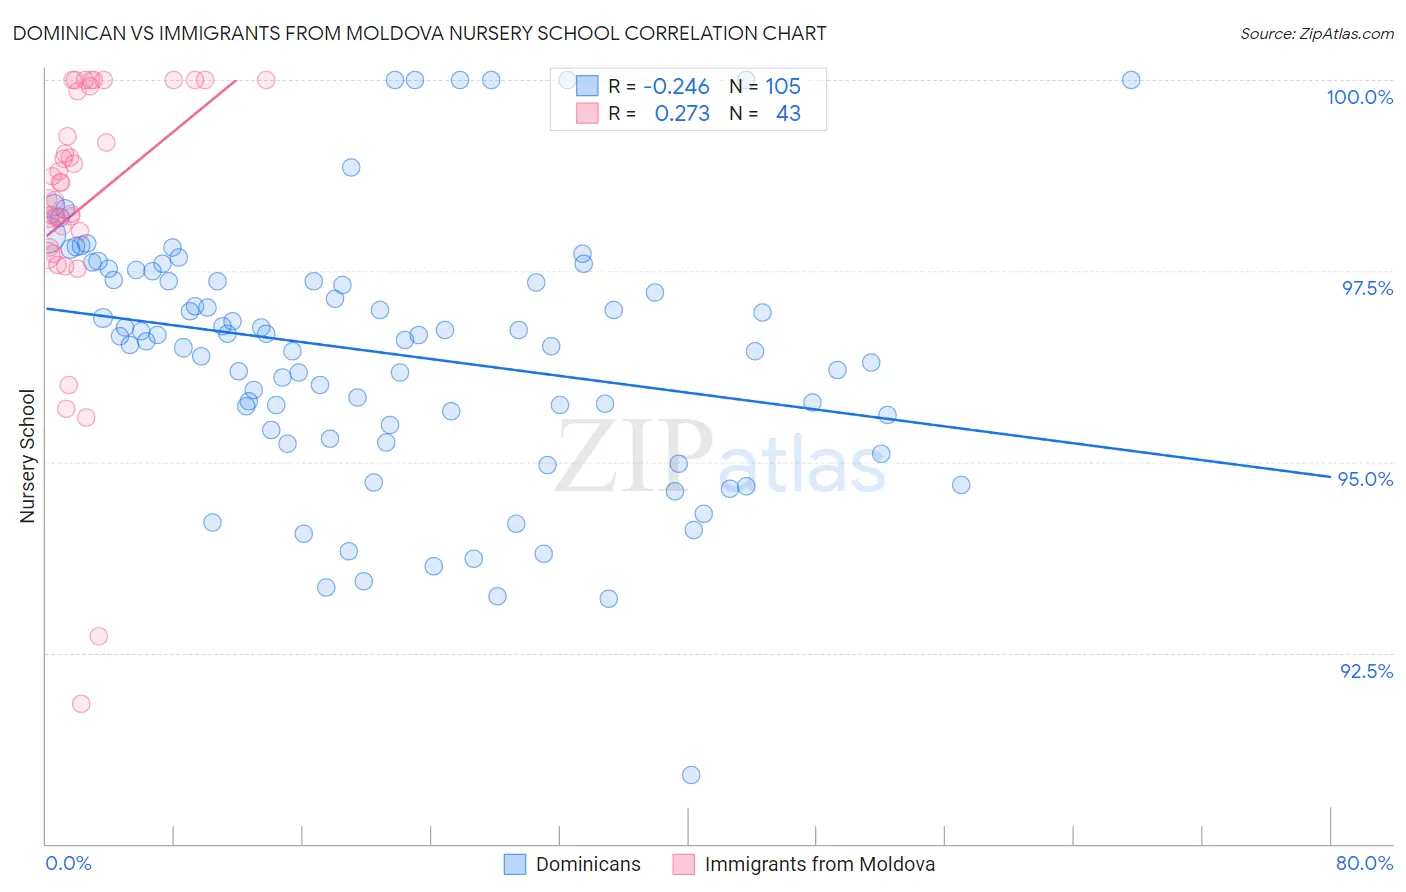
Dominican vs Immigrants from Moldova Nursery School Correlation Chart
The statistical analysis conducted on geographies consisting of 355,142,603 people shows a weak negative correlation between the proportion of Dominicans and percentage of population with at least nursery school education in the United States with a correlation coefficient (R) of -0.246 and weighted average of 96.8%. Similarly, the statistical analysis conducted on geographies consisting of 124,398,501 people shows a weak positive correlation between the proportion of Immigrants from Moldova and percentage of population with at least nursery school education in the United States with a correlation coefficient (R) of 0.273 and weighted average of 98.0%, a difference of 1.3%.
Nursery School Correlation Summary
| Measurement | Dominican | Immigrants from Moldova |
| Minimum | 90.9% | 91.8% |
| Maximum | 100.0% | 100.0% |
| Range | 9.1% | 8.2% |
| Mean | 96.4% | 98.3% |
| Median | 96.6% | 98.7% |
| Interquartile 25% (IQ1) | 95.4% | 97.8% |
| Interquartile 75% (IQ3) | 97.4% | 99.9% |
| Interquartile Range (IQR) | 2.0% | 2.1% |
| Standard Deviation (Sample) | 1.7% | 1.8% |
| Standard Deviation (Population) | 1.7% | 1.8% |
Similar Demographics by Nursery School
Demographics Similar to Dominicans by Nursery School
In terms of nursery school, the demographic groups most similar to Dominicans are Indonesian (96.8%, a difference of 0.0%), Vietnamese (96.8%, a difference of 0.030%), Mexican American Indian (96.9%, a difference of 0.040%), Immigrants from Honduras (96.9%, a difference of 0.040%), and Immigrants from Burma/Myanmar (96.9%, a difference of 0.060%).
| Demographics | Rating | Rank | Nursery School |
| Immigrants | Guyana | 0.0 /100 | #318 | Tragic 96.9% |
| Immigrants | Laos | 0.0 /100 | #319 | Tragic 96.9% |
| Immigrants | Burma/Myanmar | 0.0 /100 | #320 | Tragic 96.9% |
| Immigrants | Bangladesh | 0.0 /100 | #321 | Tragic 96.9% |
| Mexican American Indians | 0.0 /100 | #322 | Tragic 96.9% |
| Immigrants | Honduras | 0.0 /100 | #323 | Tragic 96.9% |
| Vietnamese | 0.0 /100 | #324 | Tragic 96.8% |
| Dominicans | 0.0 /100 | #325 | Tragic 96.8% |
| Indonesians | 0.0 /100 | #326 | Tragic 96.8% |
| Mexicans | 0.0 /100 | #327 | Tragic 96.8% |
| Immigrants | Latin America | 0.0 /100 | #328 | Tragic 96.7% |
| Immigrants | Vietnam | 0.0 /100 | #329 | Tragic 96.7% |
| Japanese | 0.0 /100 | #330 | Tragic 96.7% |
| Immigrants | Armenia | 0.0 /100 | #331 | Tragic 96.7% |
| Yakama | 0.0 /100 | #332 | Tragic 96.6% |
Demographics Similar to Immigrants from Moldova by Nursery School
In terms of nursery school, the demographic groups most similar to Immigrants from Moldova are Dutch West Indian (98.0%, a difference of 0.0%), Immigrants from Iran (98.0%, a difference of 0.0%), Apache (98.1%, a difference of 0.010%), Jordanian (98.1%, a difference of 0.010%), and Soviet Union (98.0%, a difference of 0.010%).
| Demographics | Rating | Rank | Nursery School |
| Filipinos | 78.5 /100 | #146 | Good 98.1% |
| Hmong | 75.7 /100 | #147 | Good 98.1% |
| Immigrants | Greece | 75.4 /100 | #148 | Good 98.1% |
| Apache | 73.2 /100 | #149 | Good 98.1% |
| Jordanians | 72.9 /100 | #150 | Good 98.1% |
| Soviet Union | 71.6 /100 | #151 | Good 98.0% |
| Dutch West Indians | 70.2 /100 | #152 | Good 98.0% |
| Immigrants | Moldova | 69.6 /100 | #153 | Good 98.0% |
| Immigrants | Iran | 68.7 /100 | #154 | Good 98.0% |
| Immigrants | South Central Asia | 66.7 /100 | #155 | Good 98.0% |
| Venezuelans | 66.6 /100 | #156 | Good 98.0% |
| Comanche | 66.0 /100 | #157 | Good 98.0% |
| Immigrants | North Macedonia | 65.7 /100 | #158 | Good 98.0% |
| French American Indians | 62.1 /100 | #159 | Good 98.0% |
| Immigrants | Russia | 59.9 /100 | #160 | Average 98.0% |