Dominican vs Hawaiian Nursery School
COMPARE
Dominican
Hawaiian
Nursery School
Nursery School Comparison
Dominicans
Hawaiians
96.8%
NURSERY SCHOOL
0.0/ 100
METRIC RATING
325th/ 347
METRIC RANK
97.9%
NURSERY SCHOOL
27.2/ 100
METRIC RATING
195th/ 347
METRIC RANK
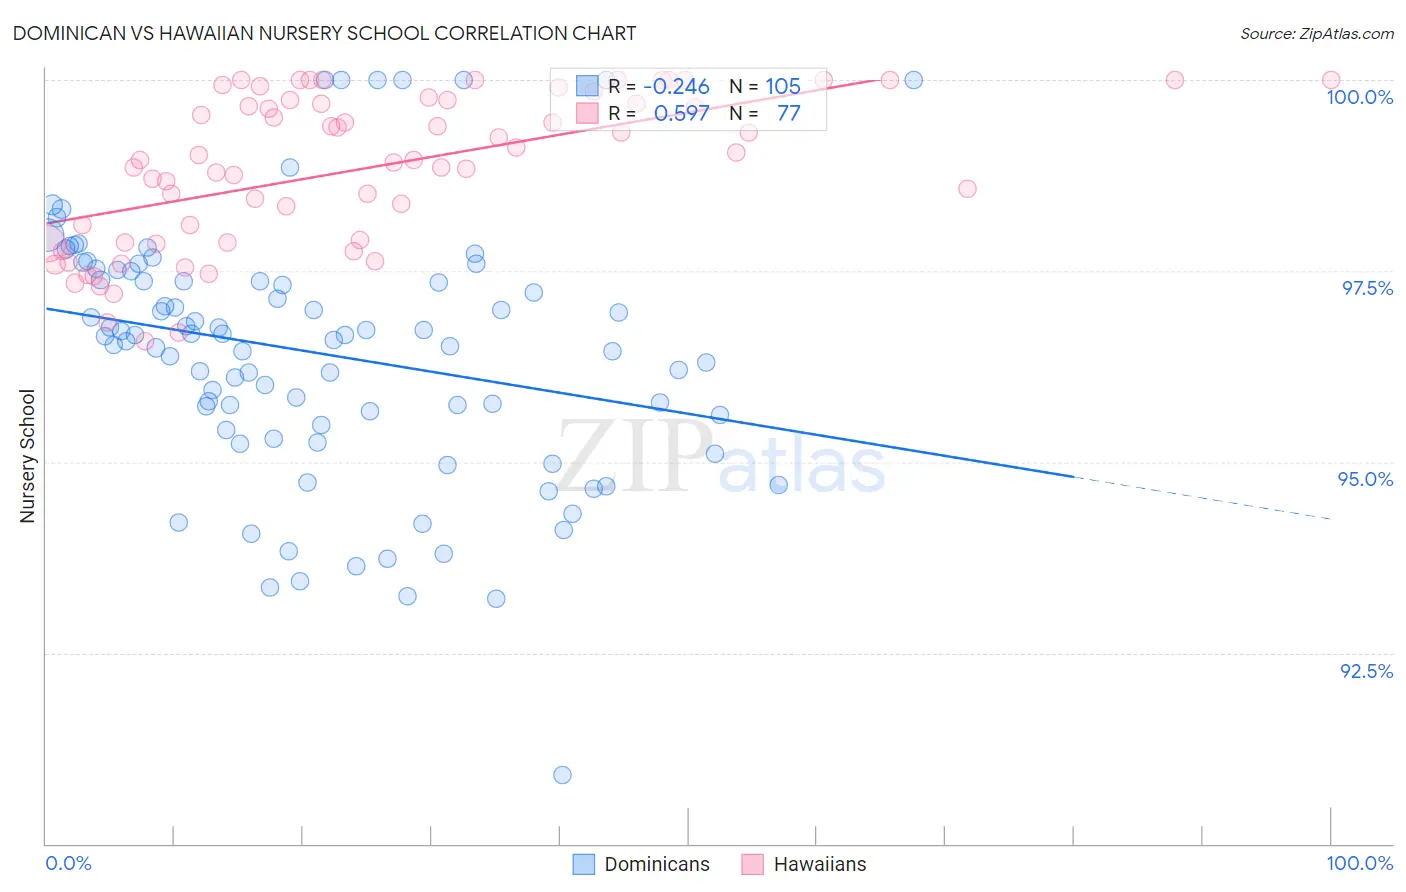
Dominican vs Hawaiian Nursery School Correlation Chart
The statistical analysis conducted on geographies consisting of 355,142,603 people shows a weak negative correlation between the proportion of Dominicans and percentage of population with at least nursery school education in the United States with a correlation coefficient (R) of -0.246 and weighted average of 96.8%. Similarly, the statistical analysis conducted on geographies consisting of 327,621,279 people shows a substantial positive correlation between the proportion of Hawaiians and percentage of population with at least nursery school education in the United States with a correlation coefficient (R) of 0.597 and weighted average of 97.9%, a difference of 1.1%.
Nursery School Correlation Summary
| Measurement | Dominican | Hawaiian |
| Minimum | 90.9% | 96.6% |
| Maximum | 100.0% | 100.0% |
| Range | 9.1% | 3.4% |
| Mean | 96.4% | 98.8% |
| Median | 96.6% | 99.0% |
| Interquartile 25% (IQ1) | 95.4% | 97.9% |
| Interquartile 75% (IQ3) | 97.4% | 99.7% |
| Interquartile Range (IQR) | 2.0% | 1.9% |
| Standard Deviation (Sample) | 1.7% | 0.99% |
| Standard Deviation (Population) | 1.7% | 0.99% |
Similar Demographics by Nursery School
Demographics Similar to Dominicans by Nursery School
In terms of nursery school, the demographic groups most similar to Dominicans are Indonesian (96.8%, a difference of 0.0%), Vietnamese (96.8%, a difference of 0.030%), Mexican American Indian (96.9%, a difference of 0.040%), Immigrants from Honduras (96.9%, a difference of 0.040%), and Immigrants from Burma/Myanmar (96.9%, a difference of 0.060%).
| Demographics | Rating | Rank | Nursery School |
| Immigrants | Guyana | 0.0 /100 | #318 | Tragic 96.9% |
| Immigrants | Laos | 0.0 /100 | #319 | Tragic 96.9% |
| Immigrants | Burma/Myanmar | 0.0 /100 | #320 | Tragic 96.9% |
| Immigrants | Bangladesh | 0.0 /100 | #321 | Tragic 96.9% |
| Mexican American Indians | 0.0 /100 | #322 | Tragic 96.9% |
| Immigrants | Honduras | 0.0 /100 | #323 | Tragic 96.9% |
| Vietnamese | 0.0 /100 | #324 | Tragic 96.8% |
| Dominicans | 0.0 /100 | #325 | Tragic 96.8% |
| Indonesians | 0.0 /100 | #326 | Tragic 96.8% |
| Mexicans | 0.0 /100 | #327 | Tragic 96.8% |
| Immigrants | Latin America | 0.0 /100 | #328 | Tragic 96.7% |
| Immigrants | Vietnam | 0.0 /100 | #329 | Tragic 96.7% |
| Japanese | 0.0 /100 | #330 | Tragic 96.7% |
| Immigrants | Armenia | 0.0 /100 | #331 | Tragic 96.7% |
| Yakama | 0.0 /100 | #332 | Tragic 96.6% |
Demographics Similar to Hawaiians by Nursery School
In terms of nursery school, the demographic groups most similar to Hawaiians are Paraguayan (97.9%, a difference of 0.0%), Mongolian (97.9%, a difference of 0.0%), Immigrants from Taiwan (97.9%, a difference of 0.010%), Black/African American (97.9%, a difference of 0.010%), and Guamanian/Chamorro (97.9%, a difference of 0.010%).
| Demographics | Rating | Rank | Nursery School |
| Arabs | 34.7 /100 | #188 | Fair 97.9% |
| Pakistanis | 34.6 /100 | #189 | Fair 97.9% |
| Panamanians | 34.3 /100 | #190 | Fair 97.9% |
| Immigrants | Taiwan | 30.6 /100 | #191 | Fair 97.9% |
| Blacks/African Americans | 29.4 /100 | #192 | Fair 97.9% |
| Paraguayans | 27.4 /100 | #193 | Fair 97.9% |
| Mongolians | 27.3 /100 | #194 | Fair 97.9% |
| Hawaiians | 27.2 /100 | #195 | Fair 97.9% |
| Guamanians/Chamorros | 25.7 /100 | #196 | Fair 97.9% |
| Yuman | 25.7 /100 | #197 | Fair 97.9% |
| Immigrants | Kenya | 24.1 /100 | #198 | Fair 97.9% |
| Immigrants | Egypt | 22.5 /100 | #199 | Fair 97.9% |
| Tohono O'odham | 22.2 /100 | #200 | Fair 97.9% |
| Immigrants | Lebanon | 21.2 /100 | #201 | Fair 97.9% |
| Immigrants | Ukraine | 19.9 /100 | #202 | Poor 97.9% |