Hmong vs Immigrants from Micronesia Nursery School
COMPARE
Hmong
Immigrants from Micronesia
Nursery School
Nursery School Comparison
Hmong
Immigrants from Micronesia
98.1%
NURSERY SCHOOL
75.7/ 100
METRIC RATING
147th/ 347
METRIC RANK
98.0%
NURSERY SCHOOL
55.0/ 100
METRIC RATING
168th/ 347
METRIC RANK
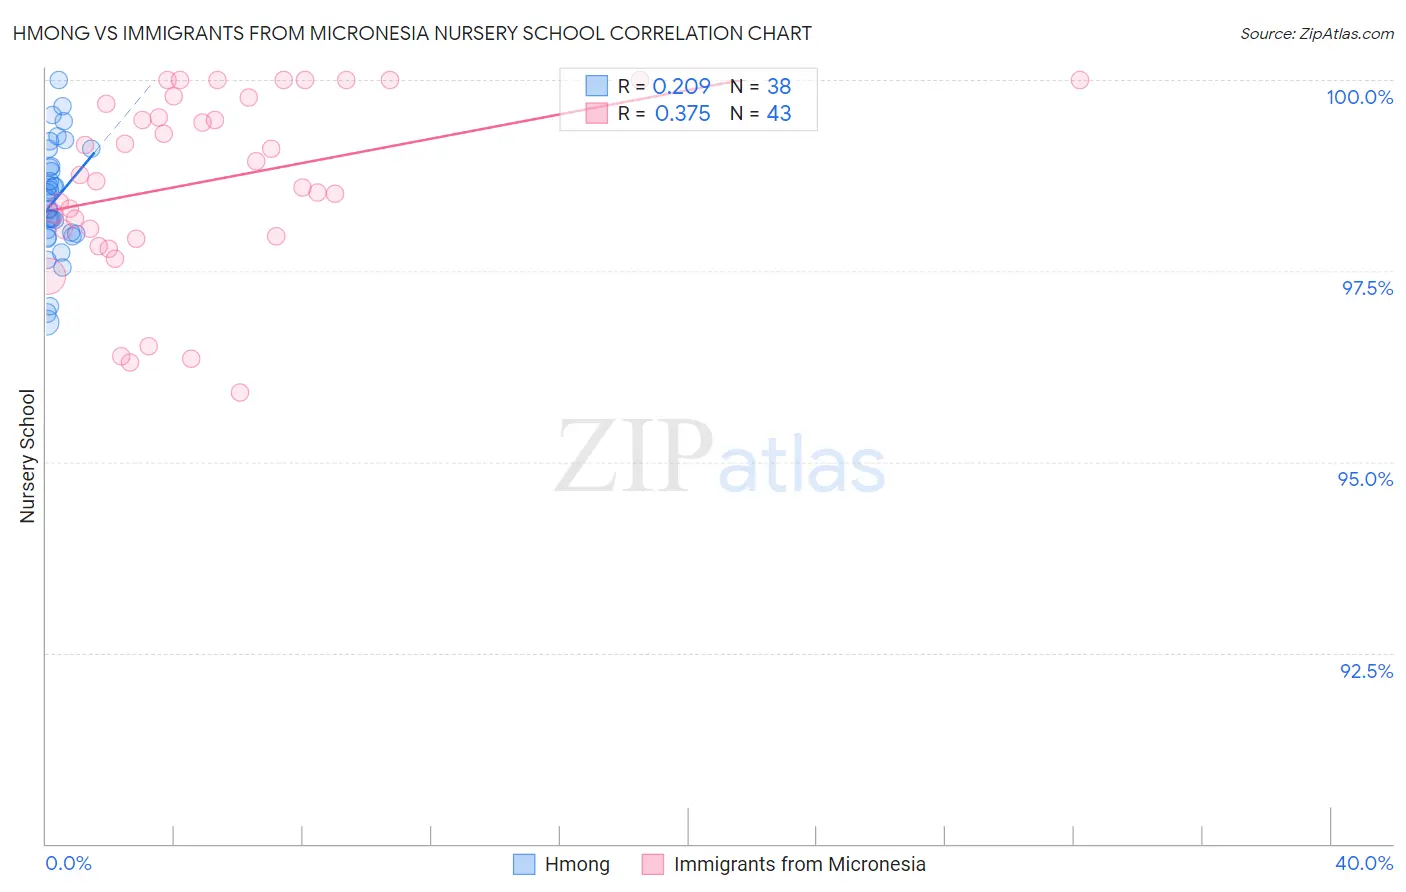
Hmong vs Immigrants from Micronesia Nursery School Correlation Chart
The statistical analysis conducted on geographies consisting of 24,672,093 people shows a weak positive correlation between the proportion of Hmong and percentage of population with at least nursery school education in the United States with a correlation coefficient (R) of 0.209 and weighted average of 98.1%. Similarly, the statistical analysis conducted on geographies consisting of 61,604,657 people shows a mild positive correlation between the proportion of Immigrants from Micronesia and percentage of population with at least nursery school education in the United States with a correlation coefficient (R) of 0.375 and weighted average of 98.0%, a difference of 0.070%.
Nursery School Correlation Summary
| Measurement | Hmong | Immigrants from Micronesia |
| Minimum | 96.8% | 95.9% |
| Maximum | 100.0% | 100.0% |
| Range | 3.2% | 4.1% |
| Mean | 98.4% | 98.7% |
| Median | 98.4% | 98.8% |
| Interquartile 25% (IQ1) | 98.0% | 98.0% |
| Interquartile 75% (IQ3) | 98.9% | 99.8% |
| Interquartile Range (IQR) | 0.87% | 1.8% |
| Standard Deviation (Sample) | 0.73% | 1.2% |
| Standard Deviation (Population) | 0.72% | 1.2% |
Similar Demographics by Nursery School
Demographics Similar to Hmong by Nursery School
In terms of nursery school, the demographic groups most similar to Hmong are Immigrants from Greece (98.1%, a difference of 0.0%), Immigrants from Israel (98.1%, a difference of 0.010%), Filipino (98.1%, a difference of 0.010%), Apache (98.1%, a difference of 0.010%), and Jordanian (98.1%, a difference of 0.010%).
| Demographics | Rating | Rank | Nursery School |
| Palestinians | 83.7 /100 | #140 | Excellent 98.1% |
| Immigrants | Turkey | 83.0 /100 | #141 | Excellent 98.1% |
| Burmese | 81.7 /100 | #142 | Excellent 98.1% |
| Marshallese | 81.2 /100 | #143 | Excellent 98.1% |
| Alsatians | 80.3 /100 | #144 | Excellent 98.1% |
| Immigrants | Israel | 78.5 /100 | #145 | Good 98.1% |
| Filipinos | 78.5 /100 | #146 | Good 98.1% |
| Hmong | 75.7 /100 | #147 | Good 98.1% |
| Immigrants | Greece | 75.4 /100 | #148 | Good 98.1% |
| Apache | 73.2 /100 | #149 | Good 98.1% |
| Jordanians | 72.9 /100 | #150 | Good 98.1% |
| Soviet Union | 71.6 /100 | #151 | Good 98.0% |
| Dutch West Indians | 70.2 /100 | #152 | Good 98.0% |
| Immigrants | Moldova | 69.6 /100 | #153 | Good 98.0% |
| Immigrants | Iran | 68.7 /100 | #154 | Good 98.0% |
Demographics Similar to Immigrants from Micronesia by Nursery School
In terms of nursery school, the demographic groups most similar to Immigrants from Micronesia are Ugandan (98.0%, a difference of 0.0%), Chilean (98.0%, a difference of 0.0%), Spanish American (98.0%, a difference of 0.0%), Immigrants from Spain (98.0%, a difference of 0.0%), and Immigrants from Korea (98.0%, a difference of 0.0%).
| Demographics | Rating | Rank | Nursery School |
| Immigrants | Eastern Europe | 59.7 /100 | #161 | Average 98.0% |
| Brazilians | 59.4 /100 | #162 | Average 98.0% |
| Immigrants | Italy | 59.0 /100 | #163 | Average 98.0% |
| Ugandans | 56.4 /100 | #164 | Average 98.0% |
| Chileans | 56.4 /100 | #165 | Average 98.0% |
| Spanish Americans | 55.6 /100 | #166 | Average 98.0% |
| Immigrants | Spain | 55.6 /100 | #167 | Average 98.0% |
| Immigrants | Micronesia | 55.0 /100 | #168 | Average 98.0% |
| Immigrants | Korea | 53.8 /100 | #169 | Average 98.0% |
| Bermudans | 53.7 /100 | #170 | Average 98.0% |
| Immigrants | Jordan | 53.4 /100 | #171 | Average 98.0% |
| Immigrants | Brazil | 51.3 /100 | #172 | Average 98.0% |
| Kenyans | 50.2 /100 | #173 | Average 98.0% |
| Navajo | 50.0 /100 | #174 | Average 98.0% |
| Immigrants | Sri Lanka | 49.9 /100 | #175 | Average 98.0% |