Immigrants from Barbados vs Bermudan 11th Grade
COMPARE
Immigrants from Barbados
Bermudan
11th Grade
11th Grade Comparison
Immigrants from Barbados
Bermudans
90.7%
11TH GRADE
0.0/ 100
METRIC RATING
283rd/ 347
METRIC RANK
92.6%
11TH GRADE
62.3/ 100
METRIC RATING
166th/ 347
METRIC RANK
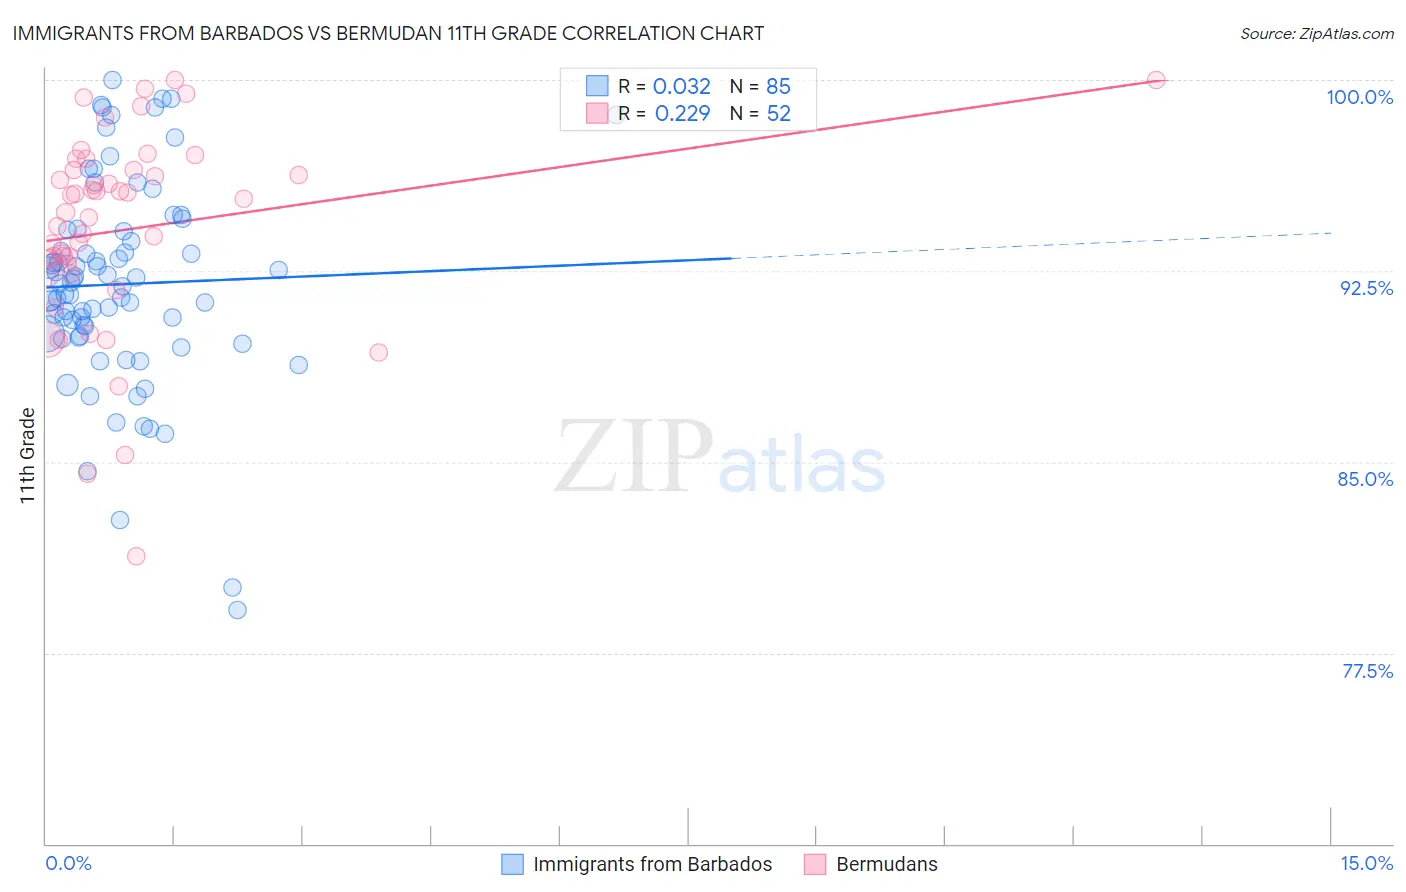
Immigrants from Barbados vs Bermudan 11th Grade Correlation Chart
The statistical analysis conducted on geographies consisting of 112,782,130 people shows no correlation between the proportion of Immigrants from Barbados and percentage of population with at least 11th grade education in the United States with a correlation coefficient (R) of 0.032 and weighted average of 90.7%. Similarly, the statistical analysis conducted on geographies consisting of 55,730,379 people shows a weak positive correlation between the proportion of Bermudans and percentage of population with at least 11th grade education in the United States with a correlation coefficient (R) of 0.229 and weighted average of 92.6%, a difference of 2.2%.
11th Grade Correlation Summary
| Measurement | Immigrants from Barbados | Bermudan |
| Minimum | 79.2% | 81.3% |
| Maximum | 100.0% | 100.0% |
| Range | 20.8% | 18.7% |
| Mean | 92.0% | 94.1% |
| Median | 92.0% | 95.1% |
| Interquartile 25% (IQ1) | 90.0% | 92.6% |
| Interquartile 75% (IQ3) | 94.1% | 96.5% |
| Interquartile Range (IQR) | 4.1% | 3.9% |
| Standard Deviation (Sample) | 4.0% | 3.9% |
| Standard Deviation (Population) | 4.0% | 3.9% |
Similar Demographics by 11th Grade
Demographics Similar to Immigrants from Barbados by 11th Grade
In terms of 11th grade, the demographic groups most similar to Immigrants from Barbados are Immigrants from St. Vincent and the Grenadines (90.7%, a difference of 0.010%), Dutch West Indian (90.7%, a difference of 0.020%), Sri Lankan (90.7%, a difference of 0.070%), Barbadian (90.8%, a difference of 0.14%), and Immigrants from Laos (90.5%, a difference of 0.17%).
| Demographics | Rating | Rank | 11th Grade |
| Bangladeshis | 0.1 /100 | #276 | Tragic 90.9% |
| Immigrants | Congo | 0.1 /100 | #277 | Tragic 90.9% |
| Malaysians | 0.1 /100 | #278 | Tragic 90.8% |
| Barbadians | 0.0 /100 | #279 | Tragic 90.8% |
| Sri Lankans | 0.0 /100 | #280 | Tragic 90.7% |
| Dutch West Indians | 0.0 /100 | #281 | Tragic 90.7% |
| Immigrants | St. Vincent and the Grenadines | 0.0 /100 | #282 | Tragic 90.7% |
| Immigrants | Barbados | 0.0 /100 | #283 | Tragic 90.7% |
| Immigrants | Laos | 0.0 /100 | #284 | Tragic 90.5% |
| Immigrants | Burma/Myanmar | 0.0 /100 | #285 | Tragic 90.4% |
| Immigrants | West Indies | 0.0 /100 | #286 | Tragic 90.4% |
| Apache | 0.0 /100 | #287 | Tragic 90.4% |
| Pennsylvania Germans | 0.0 /100 | #288 | Tragic 90.3% |
| British West Indians | 0.0 /100 | #289 | Tragic 90.3% |
| Indonesians | 0.0 /100 | #290 | Tragic 90.3% |
Demographics Similar to Bermudans by 11th Grade
In terms of 11th grade, the demographic groups most similar to Bermudans are Immigrants from Iraq (92.6%, a difference of 0.010%), Alsatian (92.6%, a difference of 0.020%), Spanish (92.7%, a difference of 0.040%), Sierra Leonean (92.6%, a difference of 0.040%), and Nonimmigrants (92.7%, a difference of 0.050%).
| Demographics | Rating | Rank | 11th Grade |
| Americans | 71.7 /100 | #159 | Good 92.7% |
| Immigrants | Lebanon | 70.7 /100 | #160 | Good 92.7% |
| Immigrants | Argentina | 69.8 /100 | #161 | Good 92.7% |
| Paraguayans | 68.7 /100 | #162 | Good 92.7% |
| Immigrants | Nonimmigrants | 66.6 /100 | #163 | Good 92.7% |
| Spanish | 66.2 /100 | #164 | Good 92.7% |
| Immigrants | Iraq | 63.7 /100 | #165 | Good 92.6% |
| Bermudans | 62.3 /100 | #166 | Good 92.6% |
| Alsatians | 60.2 /100 | #167 | Good 92.6% |
| Sierra Leoneans | 58.7 /100 | #168 | Average 92.6% |
| Immigrants | Albania | 57.8 /100 | #169 | Average 92.6% |
| Immigrants | Northern Africa | 57.3 /100 | #170 | Average 92.6% |
| Laotians | 54.4 /100 | #171 | Average 92.6% |
| Immigrants | Pakistan | 52.3 /100 | #172 | Average 92.5% |
| Indians (Asian) | 51.5 /100 | #173 | Average 92.5% |