Apache vs Bermudan 11th Grade

COMPARE

Apache
Race
Ancestry
AfghanAfricanAlaska NativeAlaskan AthabascanAlbanianAleutAlsatianAmericanApacheArabArapahoArgentineanArmenianAssyrian/Chaldean/SyriacAustralianAustrianBahamianBangladeshiBarbadianBasqueBelgianBelizeanBhutaneseBlackfeetBolivianBrazilianBritishBritish West IndianBulgarianBurmeseCajunCambodianCanadianCape VerdeanCarpatho RusynCelticCentral AmericanCentral American IndianCherokeeCheyenneChickasawChileanChineseChippewaChoctawColombianColvilleComancheCosta RicanCreeCreekCroatianCrowCubanCypriotCzechCzechoslovakianDanishDelawareDominicanDutchDutch West IndianEastern EuropeanEcuadorianEgyptianEnglishEstonianEthiopianEuropeanFijianFilipinoFinnishFrenchFrench American IndianFrench CanadianGermanGerman RussianGhanaianGreekGuamanian/ChamorroGuatemalanGuyaneseHaitianHmongHonduranHopiHoumaHungarianIcelanderIndian (Asian)IndonesianInupiatIranianIraqiIrishIroquoisIsraeliItalianJamaicanJapaneseJordanianKenyanKiowaKoreanLaotianLatvianLebaneseLiberianLithuanianLumbeeLuxembourgerMacedonianMalaysianMalteseMarshalleseMenomineeMexicanMexican American IndianMongolianMoroccanNative HawaiianNavajoNepaleseNew ZealanderNicaraguanNigerianNorthern EuropeanNorwegianOkinawanOsageOttawaPaiutePakistaniPalestinianPanamanianParaguayanPennsylvania GermanPeruvianPimaPolishPortuguesePotawatomiPuebloPuerto RicanPuget Sound SalishRomanianRussianSalvadoranSamoanScandinavianScotch-IrishScottishSeminoleSenegaleseSerbianShoshoneSierra LeoneanSiouxSlavicSlovakSloveneSomaliSouth AfricanSouth AmericanSouth American IndianSoviet UnionSpaniardSpanishSpanish AmericanSpanish American IndianSri LankanSubsaharan AfricanSudaneseSwedishSwissSyrianTaiwaneseThaiTlingit-HaidaTohono O'OdhamTonganTrinidadian and TobagonianTsimshianTurkishU.S. Virgin IslanderUgandanUkrainianUruguayanUteVenezuelanVietnameseWelshWest IndianYakamaYaquiYugoslavianYumanYup'ikZimbabwean
Immigration
NonimmigrantsImmigrantsAfghanistanAfricaAlbaniaArgentinaArmeniaAsiaAustraliaAustriaBahamasBangladeshBarbadosBelarusBelgiumBelizeBoliviaBosnia and HerzegovinaBrazilBulgariaBurma/MyanmarCabo VerdeCambodiaCameroonCanadaCaribbeanCentral AmericaChileChinaColombiaCongoCosta RicaCroatiaCubaCzechoslovakiaDenmarkDominicaDominican RepublicEastern AfricaEastern AsiaEastern EuropeEcuadorEgyptEl SalvadorEnglandEritreaEthiopiaEuropeFijiFranceGermanyGhanaGreeceGrenadaGuatemalaGuyanaHaitiHondurasHong KongHungaryIndiaIndonesiaIranIraqIrelandIsraelItalyJamaicaJapanJordanKazakhstanKenyaKoreaKuwaitLaosLatin AmericaLatviaLebanonLiberiaLithuaniaMalaysiaMexicoMicronesiaMiddle AfricaMoldovaMoroccoNepalNetherlandsNicaraguaNigeriaNorth AmericaNorth MacedoniaNorthern AfricaNorthern EuropeNorwayOceaniaPakistanPanamaPeruPhilippinesPolandPortugalRomaniaRussiaSaudi ArabiaScotlandSenegalSerbiaSierra LeoneSingaporeSomaliaSouth AfricaSouth AmericaSouth Central AsiaSouth Eastern AsiaSouthern EuropeSpainSri LankaSt. Vincent and the GrenadinesSudanSwedenSwitzerlandSyriaTaiwanThailandTrinidad and TobagoTurkeyUgandaUkraineUruguayUzbekistanVenezuelaVietnamWest IndiesWestern AfricaWestern AsiaWestern EuropeYemenZaireZimbabweAzores
Bermudan
Race
Ancestry
AfghanAfricanAlaska NativeAlaskan AthabascanAlbanianAleutAlsatianAmericanArabArapahoArgentineanArmenianAssyrian/Chaldean/SyriacAustralianAustrianBahamianBangladeshiBarbadianBasqueBelgianBelizeanBermudanBhutaneseBlackfeetBolivianBrazilianBritishBritish West IndianBulgarianBurmeseCajunCambodianCanadianCape VerdeanCarpatho RusynCelticCentral AmericanCentral American IndianCherokeeCheyenneChickasawChileanChineseChippewaChoctawColombianColvilleComancheCosta RicanCreeCreekCroatianCrowCubanCypriotCzechCzechoslovakianDanishDelawareDominicanDutchDutch West IndianEastern EuropeanEcuadorianEgyptianEnglishEstonianEthiopianEuropeanFijianFilipinoFinnishFrenchFrench American IndianFrench CanadianGermanGerman RussianGhanaianGreekGuamanian/ChamorroGuatemalanGuyaneseHaitianHmongHonduranHopiHoumaHungarianIcelanderIndian (Asian)IndonesianInupiatIranianIraqiIrishIroquoisIsraeliItalianJamaicanJapaneseJordanianKenyanKiowaKoreanLaotianLatvianLebaneseLiberianLithuanianLumbeeLuxembourgerMacedonianMalaysianMalteseMarshalleseMenomineeMexicanMexican American IndianMongolianMoroccanNative HawaiianNavajoNepaleseNew ZealanderNicaraguanNigerianNorthern EuropeanNorwegianOkinawanOsageOttawaPaiutePakistaniPalestinianPanamanianParaguayanPennsylvania GermanPeruvianPimaPolishPortuguesePotawatomiPuebloPuerto RicanPuget Sound SalishRomanianRussianSalvadoranSamoanScandinavianScotch-IrishScottishSeminoleSenegaleseSerbianShoshoneSierra LeoneanSiouxSlavicSlovakSloveneSomaliSouth AfricanSouth AmericanSouth American IndianSoviet UnionSpaniardSpanishSpanish AmericanSpanish American IndianSri LankanSubsaharan AfricanSudaneseSwedishSwissSyrianTaiwaneseThaiTlingit-HaidaTohono O'OdhamTonganTrinidadian and TobagonianTsimshianTurkishU.S. Virgin IslanderUgandanUkrainianUruguayanUteVenezuelanVietnameseWelshWest IndianYakamaYaquiYugoslavianYumanYup'ikZimbabwean
Immigration
NonimmigrantsImmigrantsAfghanistanAfricaAlbaniaArgentinaArmeniaAsiaAustraliaAustriaBahamasBangladeshBarbadosBelarusBelgiumBelizeBoliviaBosnia and HerzegovinaBrazilBulgariaBurma/MyanmarCabo VerdeCambodiaCameroonCanadaCaribbeanCentral AmericaChileChinaColombiaCongoCosta RicaCroatiaCubaCzechoslovakiaDenmarkDominicaDominican RepublicEastern AfricaEastern AsiaEastern EuropeEcuadorEgyptEl SalvadorEnglandEritreaEthiopiaEuropeFijiFranceGermanyGhanaGreeceGrenadaGuatemalaGuyanaHaitiHondurasHong KongHungaryIndiaIndonesiaIranIraqIrelandIsraelItalyJamaicaJapanJordanKazakhstanKenyaKoreaKuwaitLaosLatin AmericaLatviaLebanonLiberiaLithuaniaMalaysiaMexicoMicronesiaMiddle AfricaMoldovaMoroccoNepalNetherlandsNicaraguaNigeriaNorth AmericaNorth MacedoniaNorthern AfricaNorthern EuropeNorwayOceaniaPakistanPanamaPeruPhilippinesPolandPortugalRomaniaRussiaSaudi ArabiaScotlandSenegalSerbiaSierra LeoneSingaporeSomaliaSouth AfricaSouth AmericaSouth Central AsiaSouth Eastern AsiaSouthern EuropeSpainSri LankaSt. Vincent and the GrenadinesSudanSwedenSwitzerlandSyriaTaiwanThailandTrinidad and TobagoTurkeyUgandaUkraineUruguayUzbekistanVenezuelaVietnamWest IndiesWestern AfricaWestern AsiaWestern EuropeYemenZaireZimbabweAzores
11th Grade
Income
Poverty
Unemployment
Labor Participation
Family Structure
Vehicle Availability
Education Level
Disability

11th Grade Comparison

Apache

Bermudans

Tragic
Good
90.4%
11TH GRADE
0.0/ 100
METRIC RATING
287th/ 347
METRIC RANK
92.6%
11TH GRADE
62.3/ 100
METRIC RATING
166th/ 347
METRIC RANK

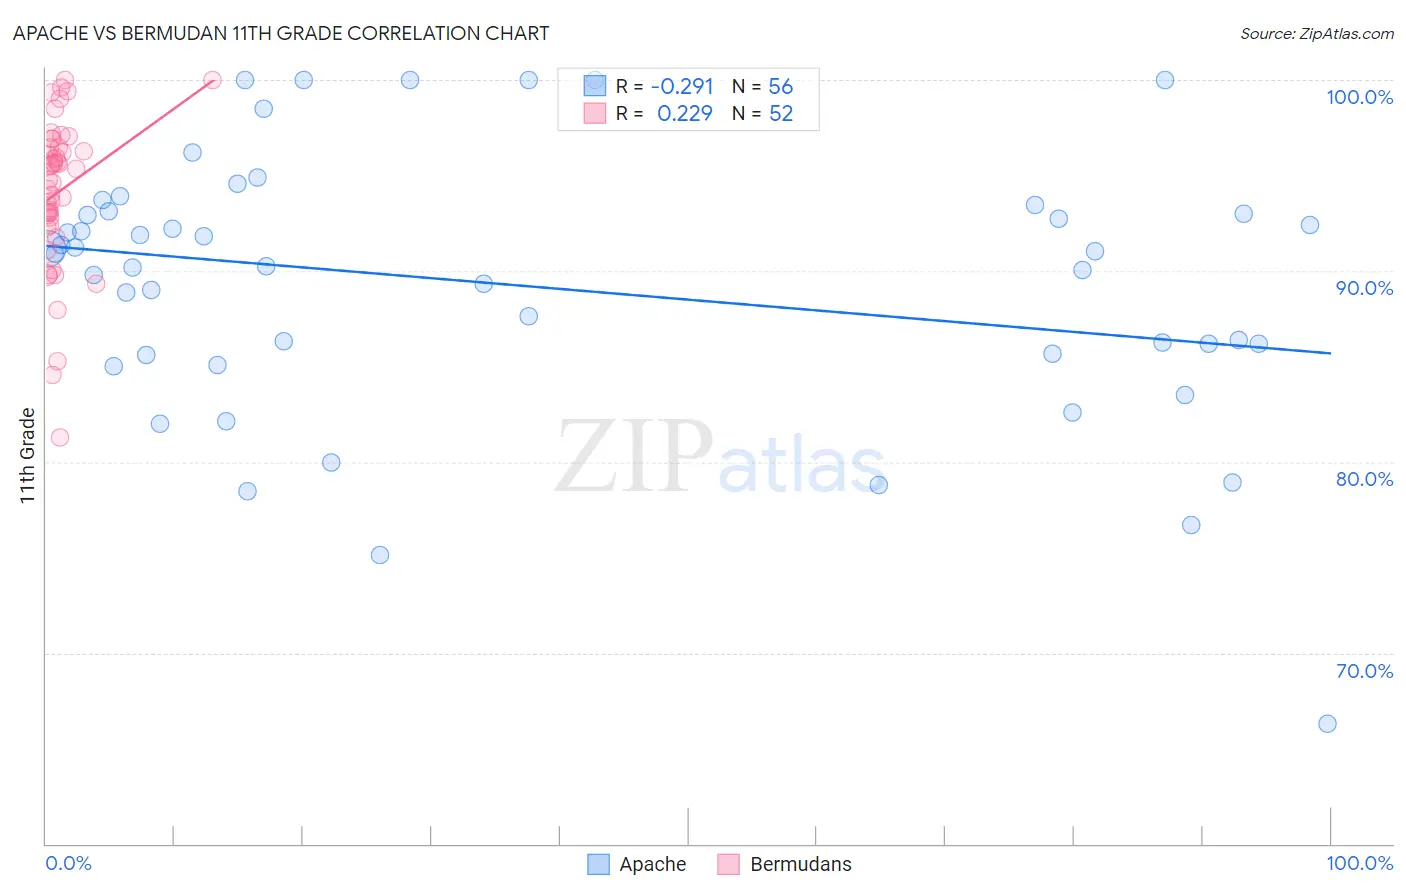
Apache vs Bermudan 11th Grade Correlation Chart

The statistical analysis conducted on geographies consisting of 231,143,094 people shows a weak negative correlation between the proportion of Apache and percentage of population with at least 11th grade education in the United States with a correlation coefficient (R) of -0.291 and weighted average of 90.4%. Similarly, the statistical analysis conducted on geographies consisting of 55,730,379 people shows a weak positive correlation between the proportion of Bermudans and percentage of population with at least 11th grade education in the United States with a correlation coefficient (R) of 0.229 and weighted average of 92.6%, a difference of 2.5%.
Apache vs Bermudan 11th Grade

11th Grade Correlation Summary

MeasurementApacheBermudan
Minimum66.3%81.3%
Maximum100.0%100.0%
Range33.7%18.7%
Mean89.2%94.1%
Median90.6%95.1%
Interquartile 25% (IQ1)85.6%92.6%
Interquartile 75% (IQ3)93.1%96.5%
Interquartile Range (IQR)7.4%3.9%
Standard Deviation (Sample)7.0%3.9%
Standard Deviation (Population)6.9%3.9%

Similar Demographics by 11th Grade

Demographics Similar to Apache by 11th Grade

In terms of 11th grade, the demographic groups most similar to Apache are Immigrants from West Indies (90.4%, a difference of 0.010%), Pennsylvania German (90.3%, a difference of 0.020%), British West Indian (90.3%, a difference of 0.050%), Immigrants from Burma/Myanmar (90.4%, a difference of 0.060%), and Indonesian (90.3%, a difference of 0.070%).
DemographicsRating | Rank11th Grade
Sri Lankans
0.0
/100
|
#280
Tragic
90.7%
Dutch West Indians
0.0
/100
|
#281
Tragic
90.7%
Immigrants | St. Vincent and the Grenadines
0.0
/100
|
#282
Tragic
90.7%
Immigrants | Barbados
0.0
/100
|
#283
Tragic
90.7%
Immigrants | Laos
0.0
/100
|
#284
Tragic
90.5%
Immigrants | Burma/Myanmar
0.0
/100
|
#285
Tragic
90.4%
Immigrants | West Indies
0.0
/100
|
#286
Tragic
90.4%
Apache
0.0
/100
|
#287
Tragic
90.4%
Pennsylvania Germans
0.0
/100
|
#288
Tragic
90.3%
British West Indians
0.0
/100
|
#289
Tragic
90.3%
Indonesians
0.0
/100
|
#290
Tragic
90.3%
Haitians
0.0
/100
|
#291
Tragic
90.3%
Cubans
0.0
/100
|
#292
Tragic
90.2%
Natives/Alaskans
0.0
/100
|
#293
Tragic
90.2%
Immigrants | Grenada
0.0
/100
|
#294
Tragic
90.1%

Demographics Similar to Bermudans by 11th Grade

In terms of 11th grade, the demographic groups most similar to Bermudans are Immigrants from Iraq (92.6%, a difference of 0.010%), Alsatian (92.6%, a difference of 0.020%), Spanish (92.7%, a difference of 0.040%), Sierra Leonean (92.6%, a difference of 0.040%), and Nonimmigrants (92.7%, a difference of 0.050%).
DemographicsRating | Rank11th Grade
Americans
71.7
/100
|
#159
Good
92.7%
Immigrants | Lebanon
70.7
/100
|
#160
Good
92.7%
Immigrants | Argentina
69.8
/100
|
#161
Good
92.7%
Paraguayans
68.7
/100
|
#162
Good
92.7%
Immigrants | Nonimmigrants
66.6
/100
|
#163
Good
92.7%
Spanish
66.2
/100
|
#164
Good
92.7%
Immigrants | Iraq
63.7
/100
|
#165
Good
92.6%
Bermudans
62.3
/100
|
#166
Good
92.6%
Alsatians
60.2
/100
|
#167
Good
92.6%
Sierra Leoneans
58.7
/100
|
#168
Average
92.6%
Immigrants | Albania
57.8
/100
|
#169
Average
92.6%
Immigrants | Northern Africa
57.3
/100
|
#170
Average
92.6%
Laotians
54.4
/100
|
#171
Average
92.6%
Immigrants | Pakistan
52.3
/100
|
#172
Average
92.5%
Indians (Asian)
51.5
/100
|
#173
Average
92.5%