Danish vs Immigrants from Bahamas GED/Equivalency
COMPARE
Danish
Immigrants from Bahamas
GED/Equivalency
GED/Equivalency Comparison
Danes
Immigrants from Bahamas
88.4%
GED/EQUIVALENCY
99.8/ 100
METRIC RATING
32nd/ 347
METRIC RANK
84.2%
GED/EQUIVALENCY
2.6/ 100
METRIC RATING
239th/ 347
METRIC RANK
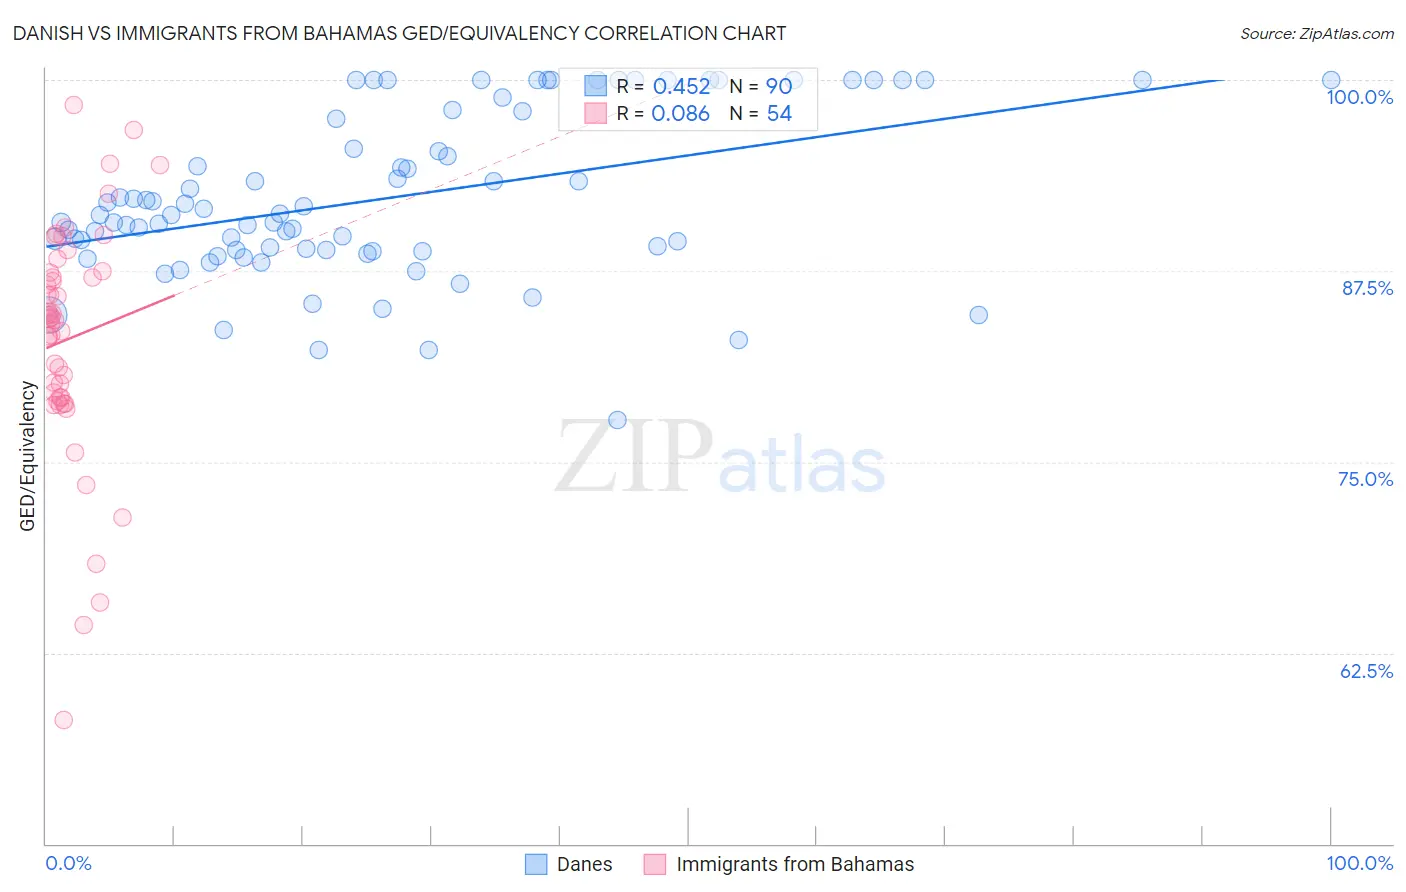
Danish vs Immigrants from Bahamas GED/Equivalency Correlation Chart
The statistical analysis conducted on geographies consisting of 474,193,540 people shows a moderate positive correlation between the proportion of Danes and percentage of population with at least ged/equivalency education in the United States with a correlation coefficient (R) of 0.452 and weighted average of 88.4%. Similarly, the statistical analysis conducted on geographies consisting of 104,666,801 people shows a slight positive correlation between the proportion of Immigrants from Bahamas and percentage of population with at least ged/equivalency education in the United States with a correlation coefficient (R) of 0.086 and weighted average of 84.2%, a difference of 5.1%.
GED/Equivalency Correlation Summary
| Measurement | Danish | Immigrants from Bahamas |
| Minimum | 77.8% | 58.1% |
| Maximum | 100.0% | 98.3% |
| Range | 22.2% | 40.3% |
| Mean | 92.3% | 83.0% |
| Median | 91.2% | 84.3% |
| Interquartile 25% (IQ1) | 88.9% | 79.2% |
| Interquartile 75% (IQ3) | 97.9% | 87.4% |
| Interquartile Range (IQR) | 9.0% | 8.2% |
| Standard Deviation (Sample) | 5.4% | 7.7% |
| Standard Deviation (Population) | 5.3% | 7.7% |
Similar Demographics by GED/Equivalency
Demographics Similar to Danes by GED/Equivalency
In terms of ged/equivalency, the demographic groups most similar to Danes are Bhutanese (88.4%, a difference of 0.020%), Immigrants from Sweden (88.4%, a difference of 0.040%), Turkish (88.5%, a difference of 0.050%), Immigrants from Japan (88.4%, a difference of 0.050%), and Immigrants from South Central Asia (88.4%, a difference of 0.060%).
| Demographics | Rating | Rank | GED/Equivalency |
| Estonians | 99.8 /100 | #25 | Exceptional 88.6% |
| Immigrants | Australia | 99.8 /100 | #26 | Exceptional 88.6% |
| Immigrants | Lithuania | 99.8 /100 | #27 | Exceptional 88.6% |
| Immigrants | Northern Europe | 99.8 /100 | #28 | Exceptional 88.5% |
| Poles | 99.8 /100 | #29 | Exceptional 88.5% |
| Turks | 99.8 /100 | #30 | Exceptional 88.5% |
| Bhutanese | 99.8 /100 | #31 | Exceptional 88.4% |
| Danes | 99.8 /100 | #32 | Exceptional 88.4% |
| Immigrants | Sweden | 99.7 /100 | #33 | Exceptional 88.4% |
| Immigrants | Japan | 99.7 /100 | #34 | Exceptional 88.4% |
| Immigrants | South Central Asia | 99.7 /100 | #35 | Exceptional 88.4% |
| Immigrants | Belgium | 99.7 /100 | #36 | Exceptional 88.3% |
| Immigrants | Austria | 99.7 /100 | #37 | Exceptional 88.3% |
| Burmese | 99.7 /100 | #38 | Exceptional 88.3% |
| Immigrants | Israel | 99.6 /100 | #39 | Exceptional 88.2% |
Demographics Similar to Immigrants from Bahamas by GED/Equivalency
In terms of ged/equivalency, the demographic groups most similar to Immigrants from Bahamas are Immigrants from South Eastern Asia (84.1%, a difference of 0.020%), Immigrants from Peru (84.2%, a difference of 0.030%), Subsaharan African (84.2%, a difference of 0.090%), Senegalese (84.0%, a difference of 0.15%), and Ghanaian (84.3%, a difference of 0.16%).
| Demographics | Rating | Rank | GED/Equivalency |
| Immigrants | South America | 4.2 /100 | #232 | Tragic 84.4% |
| Immigrants | Panama | 4.1 /100 | #233 | Tragic 84.4% |
| Immigrants | Nigeria | 3.6 /100 | #234 | Tragic 84.3% |
| Ghanaians | 3.5 /100 | #235 | Tragic 84.3% |
| Immigrants | Eritrea | 3.5 /100 | #236 | Tragic 84.3% |
| Sub-Saharan Africans | 3.0 /100 | #237 | Tragic 84.2% |
| Immigrants | Peru | 2.7 /100 | #238 | Tragic 84.2% |
| Immigrants | Bahamas | 2.6 /100 | #239 | Tragic 84.2% |
| Immigrants | South Eastern Asia | 2.5 /100 | #240 | Tragic 84.1% |
| Senegalese | 1.9 /100 | #241 | Tragic 84.0% |
| Sri Lankans | 1.9 /100 | #242 | Tragic 84.0% |
| Cherokee | 1.3 /100 | #243 | Tragic 83.9% |
| Immigrants | Ghana | 1.3 /100 | #244 | Tragic 83.9% |
| Immigrants | Senegal | 1.2 /100 | #245 | Tragic 83.8% |
| Chickasaw | 1.2 /100 | #246 | Tragic 83.8% |