Danish vs Osage High School Diploma
COMPARE
Danish
Osage
High School Diploma
High School Diploma Comparison
Danes
Osage
91.8%
HIGH SCHOOL DIPLOMA
100.0/ 100
METRIC RATING
13th/ 347
METRIC RANK
89.1%
HIGH SCHOOL DIPLOMA
48.9/ 100
METRIC RATING
176th/ 347
METRIC RANK
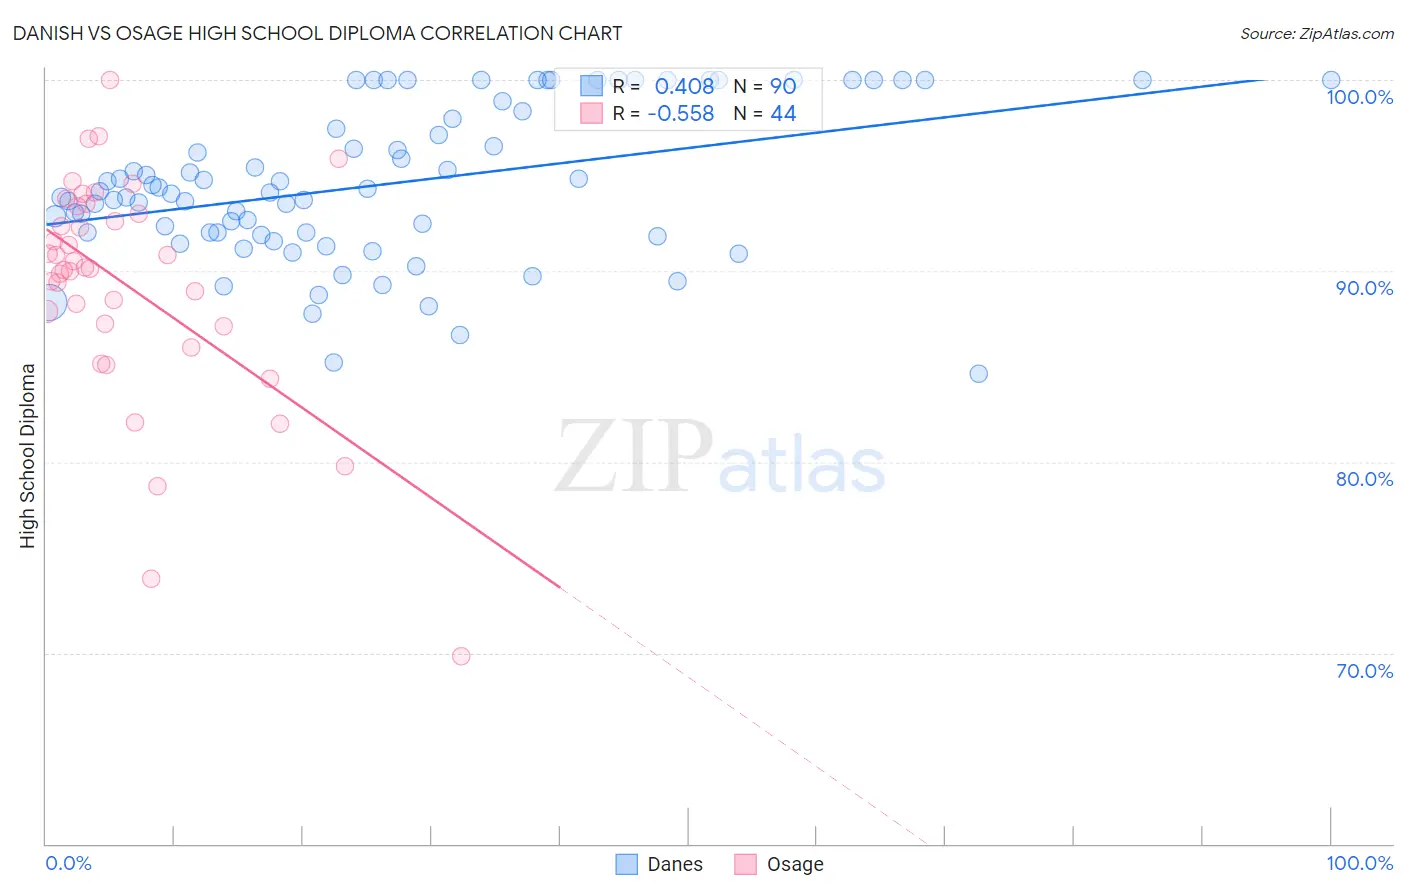
Danish vs Osage High School Diploma Correlation Chart
The statistical analysis conducted on geographies consisting of 474,193,674 people shows a moderate positive correlation between the proportion of Danes and percentage of population with at least high school diploma education in the United States with a correlation coefficient (R) of 0.408 and weighted average of 91.8%. Similarly, the statistical analysis conducted on geographies consisting of 91,808,913 people shows a substantial negative correlation between the proportion of Osage and percentage of population with at least high school diploma education in the United States with a correlation coefficient (R) of -0.558 and weighted average of 89.1%, a difference of 3.0%.
High School Diploma Correlation Summary
| Measurement | Danish | Osage |
| Minimum | 84.6% | 69.8% |
| Maximum | 100.0% | 100.0% |
| Range | 15.4% | 30.2% |
| Mean | 94.5% | 89.3% |
| Median | 94.1% | 90.1% |
| Interquartile 25% (IQ1) | 92.0% | 87.2% |
| Interquartile 75% (IQ3) | 98.3% | 93.2% |
| Interquartile Range (IQR) | 6.4% | 6.0% |
| Standard Deviation (Sample) | 4.0% | 5.9% |
| Standard Deviation (Population) | 4.0% | 5.8% |
Similar Demographics by High School Diploma
Demographics Similar to Danes by High School Diploma
In terms of high school diploma, the demographic groups most similar to Danes are Polish (91.9%, a difference of 0.050%), Bulgarian (91.8%, a difference of 0.050%), Luxembourger (91.7%, a difference of 0.080%), Eastern European (91.9%, a difference of 0.090%), and Finnish (91.7%, a difference of 0.10%).
| Demographics | Rating | Rank | High School Diploma |
| Slovaks | 100.0 /100 | #6 | Exceptional 92.0% |
| Immigrants | India | 100.0 /100 | #7 | Exceptional 92.0% |
| Chinese | 100.0 /100 | #8 | Exceptional 92.0% |
| Latvians | 100.0 /100 | #9 | Exceptional 92.0% |
| Croatians | 100.0 /100 | #10 | Exceptional 92.0% |
| Eastern Europeans | 100.0 /100 | #11 | Exceptional 91.9% |
| Poles | 100.0 /100 | #12 | Exceptional 91.9% |
| Danes | 100.0 /100 | #13 | Exceptional 91.8% |
| Bulgarians | 100.0 /100 | #14 | Exceptional 91.8% |
| Luxembourgers | 100.0 /100 | #15 | Exceptional 91.7% |
| Finns | 100.0 /100 | #16 | Exceptional 91.7% |
| Immigrants | Singapore | 99.9 /100 | #17 | Exceptional 91.7% |
| Germans | 99.9 /100 | #18 | Exceptional 91.7% |
| Maltese | 99.9 /100 | #19 | Exceptional 91.6% |
| Czechs | 99.9 /100 | #20 | Exceptional 91.6% |
Demographics Similar to Osage by High School Diploma
In terms of high school diploma, the demographic groups most similar to Osage are Immigrants from Western Asia (89.1%, a difference of 0.0%), Sudanese (89.1%, a difference of 0.010%), Sierra Leonean (89.1%, a difference of 0.010%), Immigrants from Indonesia (89.1%, a difference of 0.020%), and Hmong (89.1%, a difference of 0.020%).
| Demographics | Rating | Rank | High School Diploma |
| Iroquois | 55.1 /100 | #169 | Average 89.2% |
| Immigrants | Morocco | 53.3 /100 | #170 | Average 89.2% |
| Spanish | 52.9 /100 | #171 | Average 89.2% |
| Immigrants | Nonimmigrants | 51.8 /100 | #172 | Average 89.2% |
| Immigrants | Indonesia | 50.3 /100 | #173 | Average 89.1% |
| Hmong | 50.0 /100 | #174 | Average 89.1% |
| Immigrants | Western Asia | 49.0 /100 | #175 | Average 89.1% |
| Osage | 48.9 /100 | #176 | Average 89.1% |
| Sudanese | 48.5 /100 | #177 | Average 89.1% |
| Sierra Leoneans | 48.4 /100 | #178 | Average 89.1% |
| Americans | 47.2 /100 | #179 | Average 89.1% |
| Bolivians | 45.2 /100 | #180 | Average 89.1% |
| Venezuelans | 43.6 /100 | #181 | Average 89.1% |
| Spaniards | 43.4 /100 | #182 | Average 89.1% |
| Potawatomi | 42.5 /100 | #183 | Average 89.0% |