Indonesian vs Osage High School Diploma
COMPARE
Indonesian
Osage
High School Diploma
High School Diploma Comparison
Indonesians
Osage
86.5%
HIGH SCHOOL DIPLOMA
0.0/ 100
METRIC RATING
281st/ 347
METRIC RANK
89.1%
HIGH SCHOOL DIPLOMA
48.9/ 100
METRIC RATING
176th/ 347
METRIC RANK
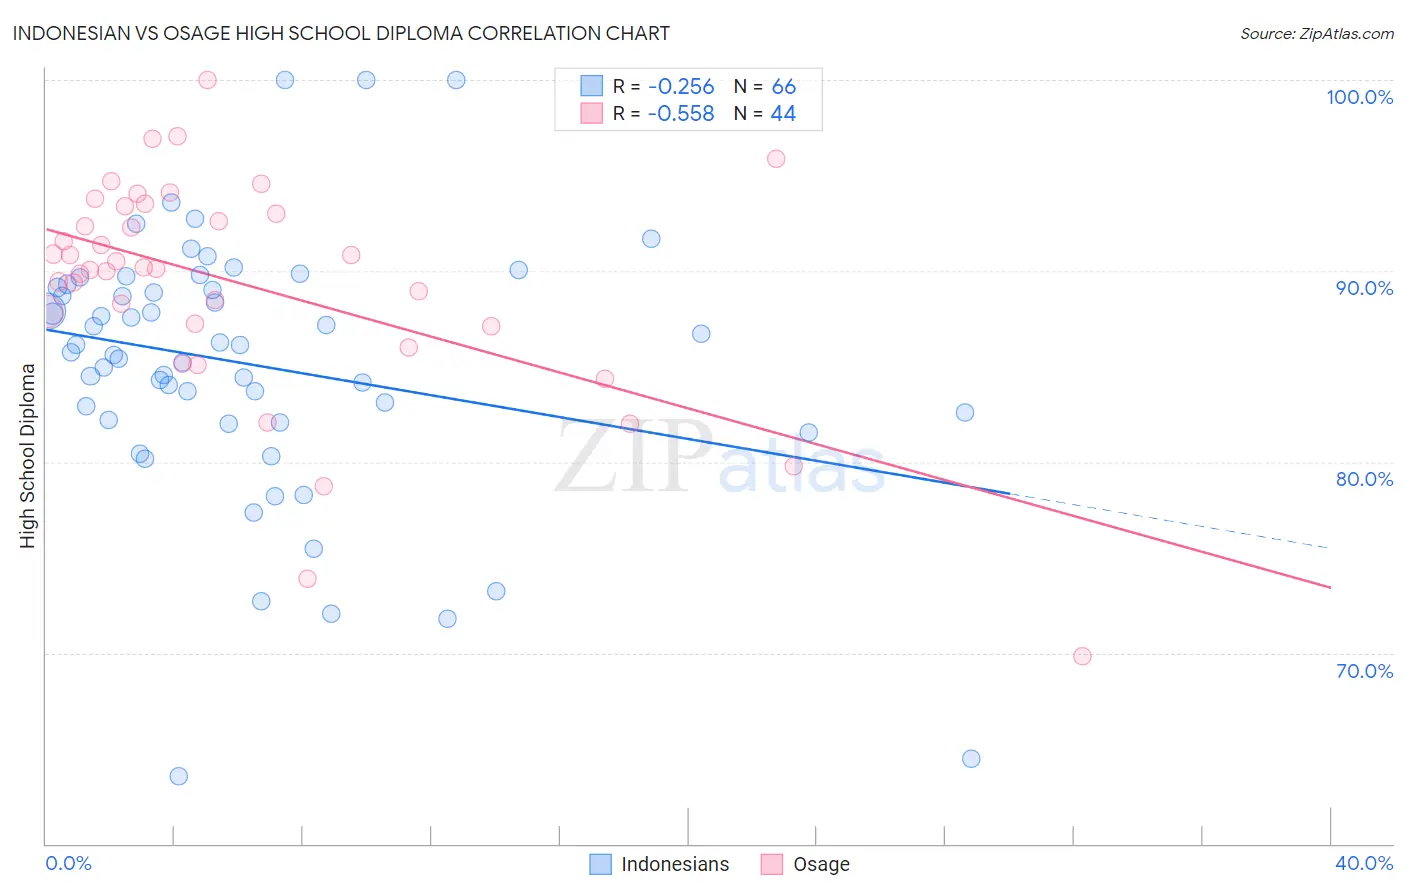
Indonesian vs Osage High School Diploma Correlation Chart
The statistical analysis conducted on geographies consisting of 162,727,113 people shows a weak negative correlation between the proportion of Indonesians and percentage of population with at least high school diploma education in the United States with a correlation coefficient (R) of -0.256 and weighted average of 86.5%. Similarly, the statistical analysis conducted on geographies consisting of 91,808,913 people shows a substantial negative correlation between the proportion of Osage and percentage of population with at least high school diploma education in the United States with a correlation coefficient (R) of -0.558 and weighted average of 89.1%, a difference of 3.0%.
High School Diploma Correlation Summary
| Measurement | Indonesian | Osage |
| Minimum | 63.6% | 69.8% |
| Maximum | 100.0% | 100.0% |
| Range | 36.4% | 30.2% |
| Mean | 85.1% | 89.3% |
| Median | 85.9% | 90.1% |
| Interquartile 25% (IQ1) | 82.2% | 87.2% |
| Interquartile 75% (IQ3) | 89.1% | 93.2% |
| Interquartile Range (IQR) | 6.9% | 6.0% |
| Standard Deviation (Sample) | 7.0% | 5.9% |
| Standard Deviation (Population) | 6.9% | 5.8% |
Similar Demographics by High School Diploma
Demographics Similar to Indonesians by High School Diploma
In terms of high school diploma, the demographic groups most similar to Indonesians are Dutch West Indian (86.5%, a difference of 0.040%), Pueblo (86.5%, a difference of 0.050%), Immigrants from Laos (86.6%, a difference of 0.070%), Immigrants from Barbados (86.4%, a difference of 0.10%), and Hopi (86.6%, a difference of 0.11%).
| Demographics | Rating | Rank | High School Diploma |
| Bangladeshis | 0.1 /100 | #274 | Tragic 86.9% |
| Immigrants | Trinidad and Tobago | 0.1 /100 | #275 | Tragic 86.8% |
| Immigrants | Burma/Myanmar | 0.1 /100 | #276 | Tragic 86.7% |
| Barbadians | 0.1 /100 | #277 | Tragic 86.7% |
| Hopi | 0.1 /100 | #278 | Tragic 86.6% |
| Immigrants | Laos | 0.0 /100 | #279 | Tragic 86.6% |
| Pueblo | 0.0 /100 | #280 | Tragic 86.5% |
| Indonesians | 0.0 /100 | #281 | Tragic 86.5% |
| Dutch West Indians | 0.0 /100 | #282 | Tragic 86.5% |
| Immigrants | Barbados | 0.0 /100 | #283 | Tragic 86.4% |
| Paiute | 0.0 /100 | #284 | Tragic 86.4% |
| Immigrants | West Indies | 0.0 /100 | #285 | Tragic 86.2% |
| Immigrants | St. Vincent and the Grenadines | 0.0 /100 | #286 | Tragic 86.2% |
| Ute | 0.0 /100 | #287 | Tragic 86.2% |
| Immigrants | Vietnam | 0.0 /100 | #288 | Tragic 86.2% |
Demographics Similar to Osage by High School Diploma
In terms of high school diploma, the demographic groups most similar to Osage are Immigrants from Western Asia (89.1%, a difference of 0.0%), Sudanese (89.1%, a difference of 0.010%), Sierra Leonean (89.1%, a difference of 0.010%), Immigrants from Indonesia (89.1%, a difference of 0.020%), and Hmong (89.1%, a difference of 0.020%).
| Demographics | Rating | Rank | High School Diploma |
| Iroquois | 55.1 /100 | #169 | Average 89.2% |
| Immigrants | Morocco | 53.3 /100 | #170 | Average 89.2% |
| Spanish | 52.9 /100 | #171 | Average 89.2% |
| Immigrants | Nonimmigrants | 51.8 /100 | #172 | Average 89.2% |
| Immigrants | Indonesia | 50.3 /100 | #173 | Average 89.1% |
| Hmong | 50.0 /100 | #174 | Average 89.1% |
| Immigrants | Western Asia | 49.0 /100 | #175 | Average 89.1% |
| Osage | 48.9 /100 | #176 | Average 89.1% |
| Sudanese | 48.5 /100 | #177 | Average 89.1% |
| Sierra Leoneans | 48.4 /100 | #178 | Average 89.1% |
| Americans | 47.2 /100 | #179 | Average 89.1% |
| Bolivians | 45.2 /100 | #180 | Average 89.1% |
| Venezuelans | 43.6 /100 | #181 | Average 89.1% |
| Spaniards | 43.4 /100 | #182 | Average 89.1% |
| Potawatomi | 42.5 /100 | #183 | Average 89.0% |