Danish vs Immigrants from Hungary High School Diploma

COMPARE

Danish
Race
Ancestry
AfghanAfricanAlaska NativeAlaskan AthabascanAlbanianAleutAlsatianAmericanApacheArabArapahoArgentineanArmenianAssyrian/Chaldean/SyriacAustralianAustrianBahamianBangladeshiBarbadianBasqueBelgianBelizeanBermudanBhutaneseBlackfeetBolivianBrazilianBritishBritish West IndianBulgarianBurmeseCajunCambodianCanadianCape VerdeanCarpatho RusynCelticCentral AmericanCentral American IndianCherokeeCheyenneChickasawChileanChineseChippewaChoctawColombianColvilleComancheCosta RicanCreeCreekCroatianCrowCubanCypriotCzechCzechoslovakianDanishDelawareDominicanDutchDutch West IndianEastern EuropeanEcuadorianEgyptianEnglishEstonianEthiopianEuropeanFijianFilipinoFinnishFrenchFrench American IndianFrench CanadianGermanGerman RussianGhanaianGreekGuamanian/ChamorroGuatemalanGuyaneseHaitianHmongHonduranHopiHoumaHungarianIcelanderIndian (Asian)IndonesianInupiatIranianIraqiIrishIroquoisIsraeliItalianJamaicanJapaneseJordanianKenyanKiowaKoreanLaotianLatvianLebaneseLiberianLithuanianLumbeeLuxembourgerMacedonianMalaysianMalteseMarshalleseMenomineeMexicanMexican American IndianMongolianMoroccanNative HawaiianNavajoNepaleseNew ZealanderNicaraguanNigerianNorthern EuropeanNorwegianOkinawanOsageOttawaPaiutePakistaniPalestinianPanamanianParaguayanPennsylvania GermanPeruvianPimaPolishPortuguesePotawatomiPuebloPuerto RicanPuget Sound SalishRomanianRussianSalvadoranSamoanScandinavianScotch-IrishScottishSeminoleSenegaleseSerbianShoshoneSierra LeoneanSiouxSlavicSlovakSloveneSomaliSouth AfricanSouth AmericanSouth American IndianSoviet UnionSpaniardSpanishSpanish AmericanSpanish American IndianSri LankanSubsaharan AfricanSudaneseSwedishSwissSyrianTaiwaneseThaiTlingit-HaidaTohono O'OdhamTonganTrinidadian and TobagonianTsimshianTurkishU.S. Virgin IslanderUgandanUkrainianUruguayanUteVenezuelanVietnameseWelshWest IndianYakamaYaquiYugoslavianYumanYup'ikZimbabwean
Immigration
NonimmigrantsImmigrantsAfghanistanAfricaAlbaniaArgentinaArmeniaAsiaAustraliaAustriaBahamasBangladeshBarbadosBelarusBelgiumBelizeBoliviaBosnia and HerzegovinaBrazilBulgariaBurma/MyanmarCabo VerdeCambodiaCameroonCanadaCaribbeanCentral AmericaChileChinaColombiaCongoCosta RicaCroatiaCubaCzechoslovakiaDenmarkDominicaDominican RepublicEastern AfricaEastern AsiaEastern EuropeEcuadorEgyptEl SalvadorEnglandEritreaEthiopiaEuropeFijiFranceGermanyGhanaGreeceGrenadaGuatemalaGuyanaHaitiHondurasHong KongIndiaIndonesiaIranIraqIrelandIsraelItalyJamaicaJapanJordanKazakhstanKenyaKoreaKuwaitLaosLatin AmericaLatviaLebanonLiberiaLithuaniaMalaysiaMexicoMicronesiaMiddle AfricaMoldovaMoroccoNepalNetherlandsNicaraguaNigeriaNorth AmericaNorth MacedoniaNorthern AfricaNorthern EuropeNorwayOceaniaPakistanPanamaPeruPhilippinesPolandPortugalRomaniaRussiaSaudi ArabiaScotlandSenegalSerbiaSierra LeoneSingaporeSomaliaSouth AfricaSouth AmericaSouth Central AsiaSouth Eastern AsiaSouthern EuropeSpainSri LankaSt. Vincent and the GrenadinesSudanSwedenSwitzerlandSyriaTaiwanThailandTrinidad and TobagoTurkeyUgandaUkraineUruguayUzbekistanVenezuelaVietnamWest IndiesWestern AfricaWestern AsiaWestern EuropeYemenZaireZimbabweAzores
Immigrants from Hungary
Race
Ancestry
AfghanAfricanAlaska NativeAlaskan AthabascanAlbanianAleutAlsatianAmericanApacheArabArapahoArgentineanArmenianAssyrian/Chaldean/SyriacAustralianAustrianBahamianBangladeshiBarbadianBasqueBelgianBelizeanBermudanBhutaneseBlackfeetBolivianBrazilianBritishBritish West IndianBulgarianBurmeseCajunCambodianCanadianCape VerdeanCarpatho RusynCelticCentral AmericanCentral American IndianCherokeeCheyenneChickasawChileanChineseChippewaChoctawColombianColvilleComancheCosta RicanCreeCreekCroatianCrowCubanCypriotCzechCzechoslovakianDelawareDominicanDutchDutch West IndianEastern EuropeanEcuadorianEgyptianEnglishEstonianEthiopianEuropeanFijianFilipinoFinnishFrenchFrench American IndianFrench CanadianGermanGerman RussianGhanaianGreekGuamanian/ChamorroGuatemalanGuyaneseHaitianHmongHonduranHopiHoumaHungarianIcelanderIndian (Asian)IndonesianInupiatIranianIraqiIrishIroquoisIsraeliItalianJamaicanJapaneseJordanianKenyanKiowaKoreanLaotianLatvianLebaneseLiberianLithuanianLumbeeLuxembourgerMacedonianMalaysianMalteseMarshalleseMenomineeMexicanMexican American IndianMongolianMoroccanNative HawaiianNavajoNepaleseNew ZealanderNicaraguanNigerianNorthern EuropeanNorwegianOkinawanOsageOttawaPaiutePakistaniPalestinianPanamanianParaguayanPennsylvania GermanPeruvianPimaPolishPortuguesePotawatomiPuebloPuerto RicanPuget Sound SalishRomanianRussianSalvadoranSamoanScandinavianScotch-IrishScottishSeminoleSenegaleseSerbianShoshoneSierra LeoneanSiouxSlavicSlovakSloveneSomaliSouth AfricanSouth AmericanSouth American IndianSoviet UnionSpaniardSpanishSpanish AmericanSpanish American IndianSri LankanSubsaharan AfricanSudaneseSwedishSwissSyrianTaiwaneseThaiTlingit-HaidaTohono O'OdhamTonganTrinidadian and TobagonianTsimshianTurkishU.S. Virgin IslanderUgandanUkrainianUruguayanUteVenezuelanVietnameseWelshWest IndianYakamaYaquiYugoslavianYumanYup'ikZimbabwean
Immigration
NonimmigrantsImmigrantsAfghanistanAfricaAlbaniaArgentinaArmeniaAsiaAustraliaAustriaBahamasBangladeshBarbadosBelarusBelgiumBelizeBoliviaBosnia and HerzegovinaBrazilBulgariaBurma/MyanmarCabo VerdeCambodiaCameroonCanadaCaribbeanCentral AmericaChileChinaColombiaCongoCosta RicaCroatiaCubaCzechoslovakiaDenmarkDominicaDominican RepublicEastern AfricaEastern AsiaEastern EuropeEcuadorEgyptEl SalvadorEnglandEritreaEthiopiaEuropeFijiFranceGermanyGhanaGreeceGrenadaGuatemalaGuyanaHaitiHondurasHong KongHungaryIndiaIndonesiaIranIraqIrelandIsraelItalyJamaicaJapanJordanKazakhstanKenyaKoreaKuwaitLaosLatin AmericaLatviaLebanonLiberiaLithuaniaMalaysiaMexicoMicronesiaMiddle AfricaMoldovaMoroccoNepalNetherlandsNicaraguaNigeriaNorth AmericaNorth MacedoniaNorthern AfricaNorthern EuropeNorwayOceaniaPakistanPanamaPeruPhilippinesPolandPortugalRomaniaRussiaSaudi ArabiaScotlandSenegalSerbiaSierra LeoneSingaporeSomaliaSouth AfricaSouth AmericaSouth Central AsiaSouth Eastern AsiaSouthern EuropeSpainSri LankaSt. Vincent and the GrenadinesSudanSwedenSwitzerlandSyriaTaiwanThailandTrinidad and TobagoTurkeyUgandaUkraineUruguayUzbekistanVenezuelaVietnamWest IndiesWestern AfricaWestern AsiaWestern EuropeYemenZaireZimbabweAzores
High School Diploma
Income
Poverty
Unemployment
Labor Participation
Family Structure
Vehicle Availability
Education Level
Disability

High School Diploma Comparison

Danes

Immigrants from Hungary

Exceptional
Exceptional
91.8%
HIGH SCHOOL DIPLOMA
100.0/ 100
METRIC RATING
13th/ 347
METRIC RANK
90.2%
HIGH SCHOOL DIPLOMA
95.8/ 100
METRIC RATING
115th/ 347
METRIC RANK

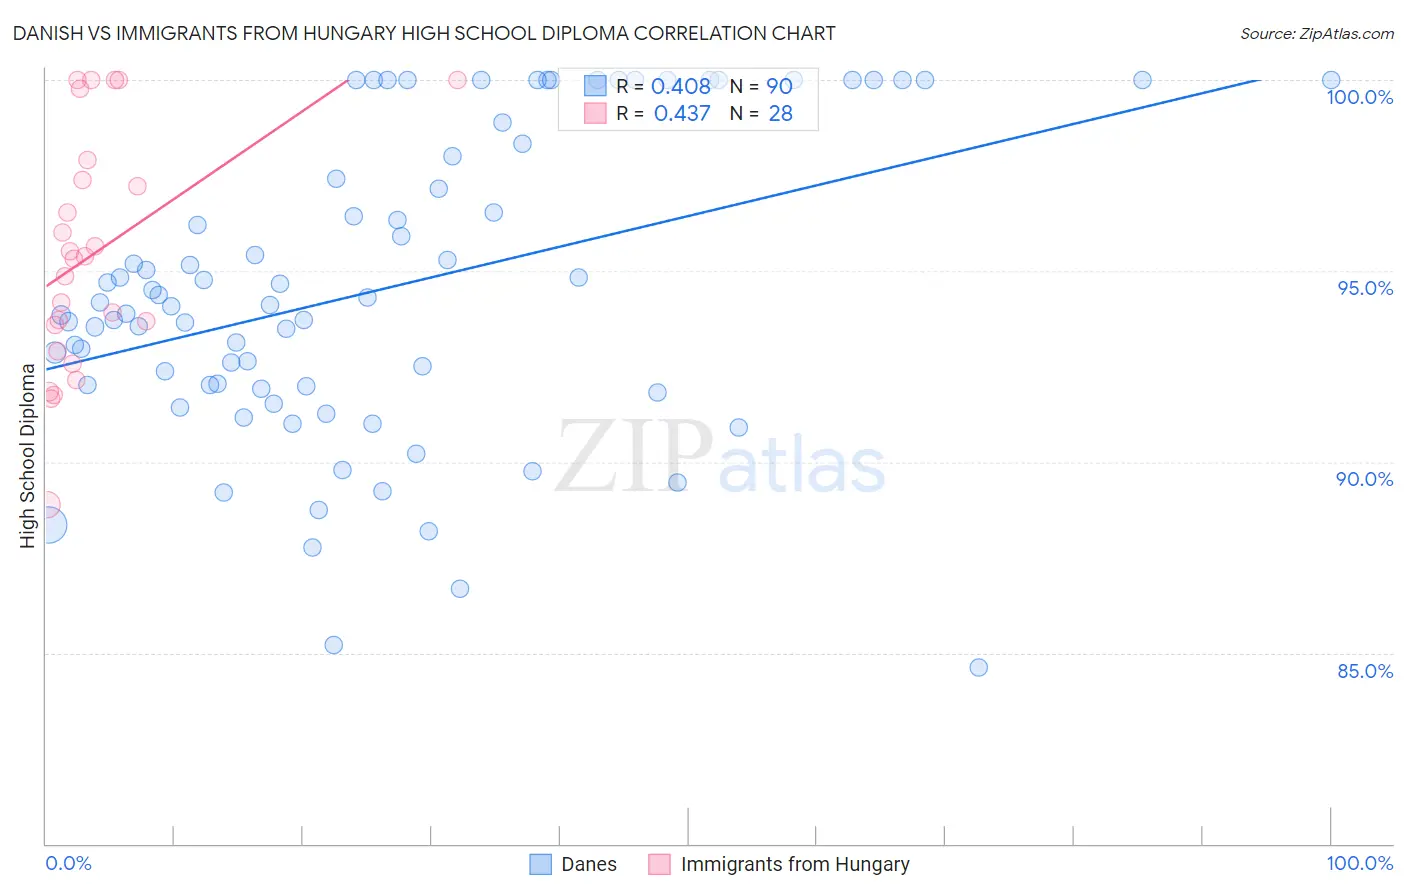
Danish vs Immigrants from Hungary High School Diploma Correlation Chart

The statistical analysis conducted on geographies consisting of 474,193,674 people shows a moderate positive correlation between the proportion of Danes and percentage of population with at least high school diploma education in the United States with a correlation coefficient (R) of 0.408 and weighted average of 91.8%. Similarly, the statistical analysis conducted on geographies consisting of 195,707,305 people shows a moderate positive correlation between the proportion of Immigrants from Hungary and percentage of population with at least high school diploma education in the United States with a correlation coefficient (R) of 0.437 and weighted average of 90.2%, a difference of 1.8%.
Danish vs Immigrants from Hungary High School Diploma

High School Diploma Correlation Summary

MeasurementDanishImmigrants from Hungary
Minimum84.6%88.9%
Maximum100.0%100.0%
Range15.4%11.1%
Mean94.5%95.4%
Median94.1%95.4%
Interquartile 25% (IQ1)92.0%93.2%
Interquartile 75% (IQ3)98.3%97.6%
Interquartile Range (IQR)6.4%4.4%
Standard Deviation (Sample)4.0%3.1%
Standard Deviation (Population)4.0%3.1%

Similar Demographics by High School Diploma

Demographics Similar to Danes by High School Diploma

In terms of high school diploma, the demographic groups most similar to Danes are Polish (91.9%, a difference of 0.050%), Bulgarian (91.8%, a difference of 0.050%), Luxembourger (91.7%, a difference of 0.080%), Eastern European (91.9%, a difference of 0.090%), and Finnish (91.7%, a difference of 0.10%).
DemographicsRating | RankHigh School Diploma
Slovaks
100.0
/100
|
#6
Exceptional
92.0%
Immigrants | India
100.0
/100
|
#7
Exceptional
92.0%
Chinese
100.0
/100
|
#8
Exceptional
92.0%
Latvians
100.0
/100
|
#9
Exceptional
92.0%
Croatians
100.0
/100
|
#10
Exceptional
92.0%
Eastern Europeans
100.0
/100
|
#11
Exceptional
91.9%
Poles
100.0
/100
|
#12
Exceptional
91.9%
Danes
100.0
/100
|
#13
Exceptional
91.8%
Bulgarians
100.0
/100
|
#14
Exceptional
91.8%
Luxembourgers
100.0
/100
|
#15
Exceptional
91.7%
Finns
100.0
/100
|
#16
Exceptional
91.7%
Immigrants | Singapore
99.9
/100
|
#17
Exceptional
91.7%
Germans
99.9
/100
|
#18
Exceptional
91.7%
Maltese
99.9
/100
|
#19
Exceptional
91.6%
Czechs
99.9
/100
|
#20
Exceptional
91.6%

Demographics Similar to Immigrants from Hungary by High School Diploma

In terms of high school diploma, the demographic groups most similar to Immigrants from Hungary are Immigrants from Germany (90.2%, a difference of 0.010%), Yugoslavian (90.2%, a difference of 0.040%), Jordanian (90.2%, a difference of 0.040%), Immigrants from Sri Lanka (90.2%, a difference of 0.050%), and Immigrants from Belarus (90.2%, a difference of 0.060%).
DemographicsRating | RankHigh School Diploma
Palestinians
96.7
/100
|
#108
Exceptional
90.3%
Immigrants | Zimbabwe
96.7
/100
|
#109
Exceptional
90.3%
Immigrants | Greece
96.6
/100
|
#110
Exceptional
90.3%
Menominee
96.6
/100
|
#111
Exceptional
90.3%
Immigrants | Belarus
96.4
/100
|
#112
Exceptional
90.2%
Immigrants | Sri Lanka
96.3
/100
|
#113
Exceptional
90.2%
Yugoslavians
96.2
/100
|
#114
Exceptional
90.2%
Immigrants | Hungary
95.8
/100
|
#115
Exceptional
90.2%
Immigrants | Germany
95.7
/100
|
#116
Exceptional
90.2%
Jordanians
95.4
/100
|
#117
Exceptional
90.2%
Israelis
95.1
/100
|
#118
Exceptional
90.1%
Immigrants | Eastern Europe
94.9
/100
|
#119
Exceptional
90.1%
Ottawa
94.4
/100
|
#120
Exceptional
90.1%
Whites/Caucasians
94.1
/100
|
#121
Exceptional
90.1%
Immigrants | Kazakhstan
93.4
/100
|
#122
Exceptional
90.0%