Czech vs South American Indian Bachelor's Degree
COMPARE
Czech
South American Indian
Bachelor's Degree
Bachelor's Degree Comparison
Czechs
South American Indians
38.0%
BACHELOR'S DEGREE
54.4/ 100
METRIC RATING
170th/ 347
METRIC RANK
39.3%
BACHELOR'S DEGREE
83.6/ 100
METRIC RATING
141st/ 347
METRIC RANK
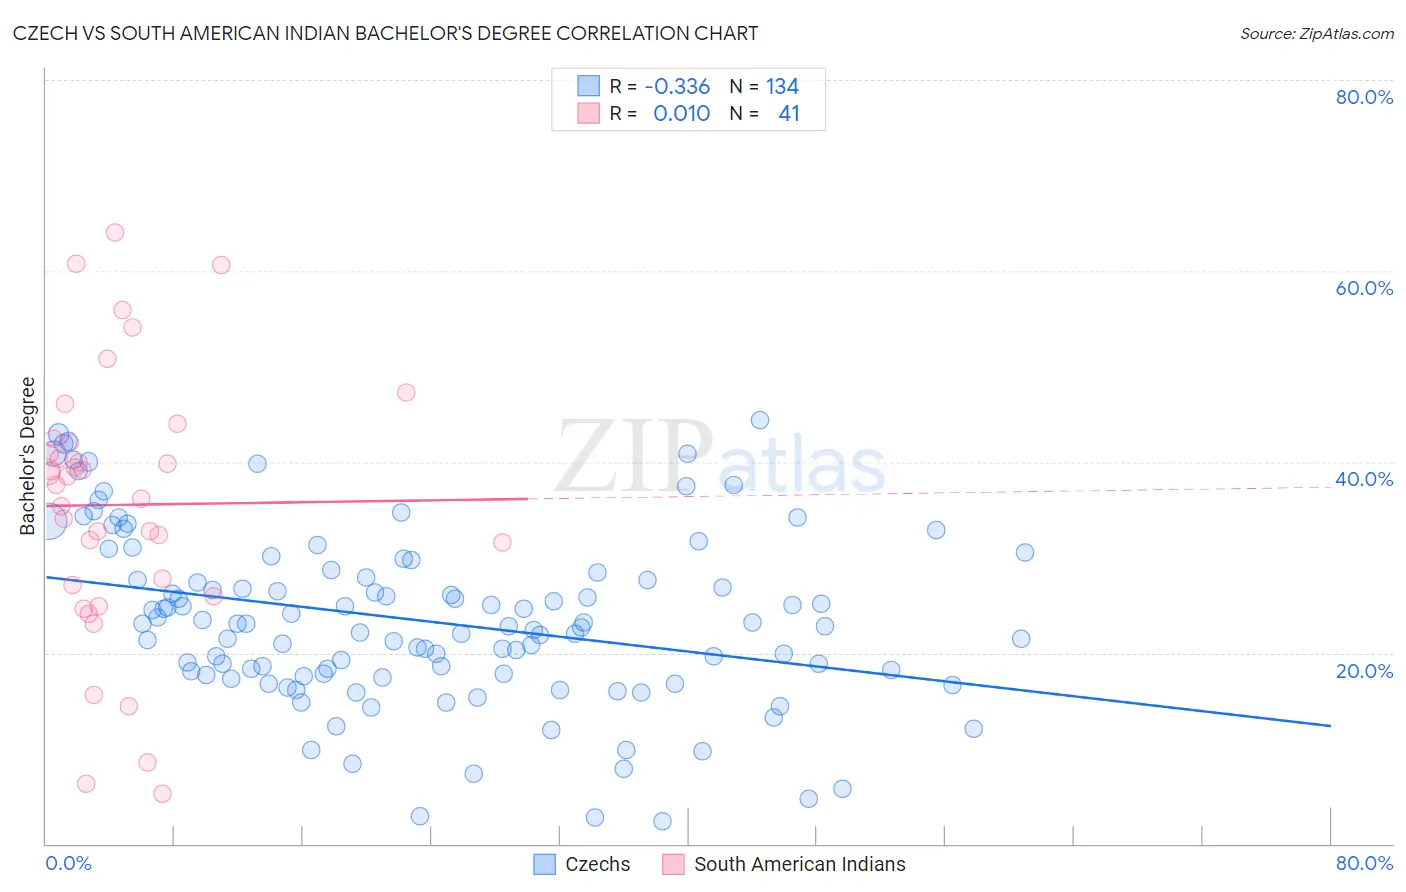
Czech vs South American Indian Bachelor's Degree Correlation Chart
The statistical analysis conducted on geographies consisting of 484,759,753 people shows a mild negative correlation between the proportion of Czechs and percentage of population with at least bachelor's degree education in the United States with a correlation coefficient (R) of -0.336 and weighted average of 38.0%. Similarly, the statistical analysis conducted on geographies consisting of 164,573,036 people shows no correlation between the proportion of South American Indians and percentage of population with at least bachelor's degree education in the United States with a correlation coefficient (R) of 0.010 and weighted average of 39.3%, a difference of 3.5%.
Bachelor's Degree Correlation Summary
| Measurement | Czech | South American Indian |
| Minimum | 2.4% | 5.3% |
| Maximum | 44.4% | 64.1% |
| Range | 42.1% | 58.8% |
| Mean | 23.4% | 35.5% |
| Median | 22.9% | 37.6% |
| Interquartile 25% (IQ1) | 17.8% | 26.5% |
| Interquartile 75% (IQ3) | 28.5% | 42.3% |
| Interquartile Range (IQR) | 10.6% | 15.8% |
| Standard Deviation (Sample) | 9.0% | 14.0% |
| Standard Deviation (Population) | 9.0% | 13.8% |
Similar Demographics by Bachelor's Degree
Demographics Similar to Czechs by Bachelor's Degree
In terms of bachelor's degree, the demographic groups most similar to Czechs are Bermudan (38.0%, a difference of 0.010%), Ghanaian (38.0%, a difference of 0.10%), Immigrants from Somalia (37.9%, a difference of 0.15%), Danish (38.1%, a difference of 0.18%), and Immigrants from Iraq (37.9%, a difference of 0.18%).
| Demographics | Rating | Rank | Bachelor's Degree |
| Peruvians | 63.4 /100 | #163 | Good 38.3% |
| Hungarians | 62.1 /100 | #164 | Good 38.3% |
| Sri Lankans | 59.1 /100 | #165 | Average 38.2% |
| Somalis | 58.6 /100 | #166 | Average 38.1% |
| Scottish | 56.6 /100 | #167 | Average 38.1% |
| Danes | 56.2 /100 | #168 | Average 38.1% |
| Ghanaians | 55.3 /100 | #169 | Average 38.0% |
| Czechs | 54.4 /100 | #170 | Average 38.0% |
| Bermudans | 54.2 /100 | #171 | Average 38.0% |
| Immigrants | Somalia | 52.8 /100 | #172 | Average 37.9% |
| Immigrants | Iraq | 52.5 /100 | #173 | Average 37.9% |
| Immigrants | Bangladesh | 50.0 /100 | #174 | Average 37.8% |
| Immigrants | Uruguay | 48.3 /100 | #175 | Average 37.8% |
| Costa Ricans | 47.6 /100 | #176 | Average 37.7% |
| Basques | 47.4 /100 | #177 | Average 37.7% |
Demographics Similar to South American Indians by Bachelor's Degree
In terms of bachelor's degree, the demographic groups most similar to South American Indians are Immigrants from Armenia (39.4%, a difference of 0.090%), Immigrants from Sudan (39.4%, a difference of 0.16%), Immigrants from North Macedonia (39.2%, a difference of 0.32%), European (39.5%, a difference of 0.35%), and Icelander (39.5%, a difference of 0.53%).
| Demographics | Rating | Rank | Bachelor's Degree |
| Assyrians/Chaldeans/Syriacs | 89.4 /100 | #134 | Excellent 39.8% |
| Luxembourgers | 89.1 /100 | #135 | Excellent 39.8% |
| Pakistanis | 88.2 /100 | #136 | Excellent 39.7% |
| Icelanders | 86.5 /100 | #137 | Excellent 39.5% |
| Europeans | 85.6 /100 | #138 | Excellent 39.5% |
| Immigrants | Sudan | 84.5 /100 | #139 | Excellent 39.4% |
| Immigrants | Armenia | 84.1 /100 | #140 | Excellent 39.4% |
| South American Indians | 83.6 /100 | #141 | Excellent 39.3% |
| Immigrants | North Macedonia | 81.6 /100 | #142 | Excellent 39.2% |
| Poles | 79.8 /100 | #143 | Good 39.1% |
| Immigrants | Afghanistan | 79.7 /100 | #144 | Good 39.1% |
| Slovenes | 79.5 /100 | #145 | Good 39.1% |
| Swedes | 79.2 /100 | #146 | Good 39.1% |
| Immigrants | Sierra Leone | 79.0 /100 | #147 | Good 39.0% |
| Iraqis | 78.1 /100 | #148 | Good 39.0% |