White/Caucasian vs Soviet Union 2nd Grade
COMPARE
White/Caucasian
Soviet Union
2nd Grade
2nd Grade Comparison
Whites/Caucasians
Soviet Union
98.4%
2ND GRADE
99.8/ 100
METRIC RATING
50th/ 347
METRIC RANK
97.9%
2ND GRADE
70.7/ 100
METRIC RATING
151st/ 347
METRIC RANK
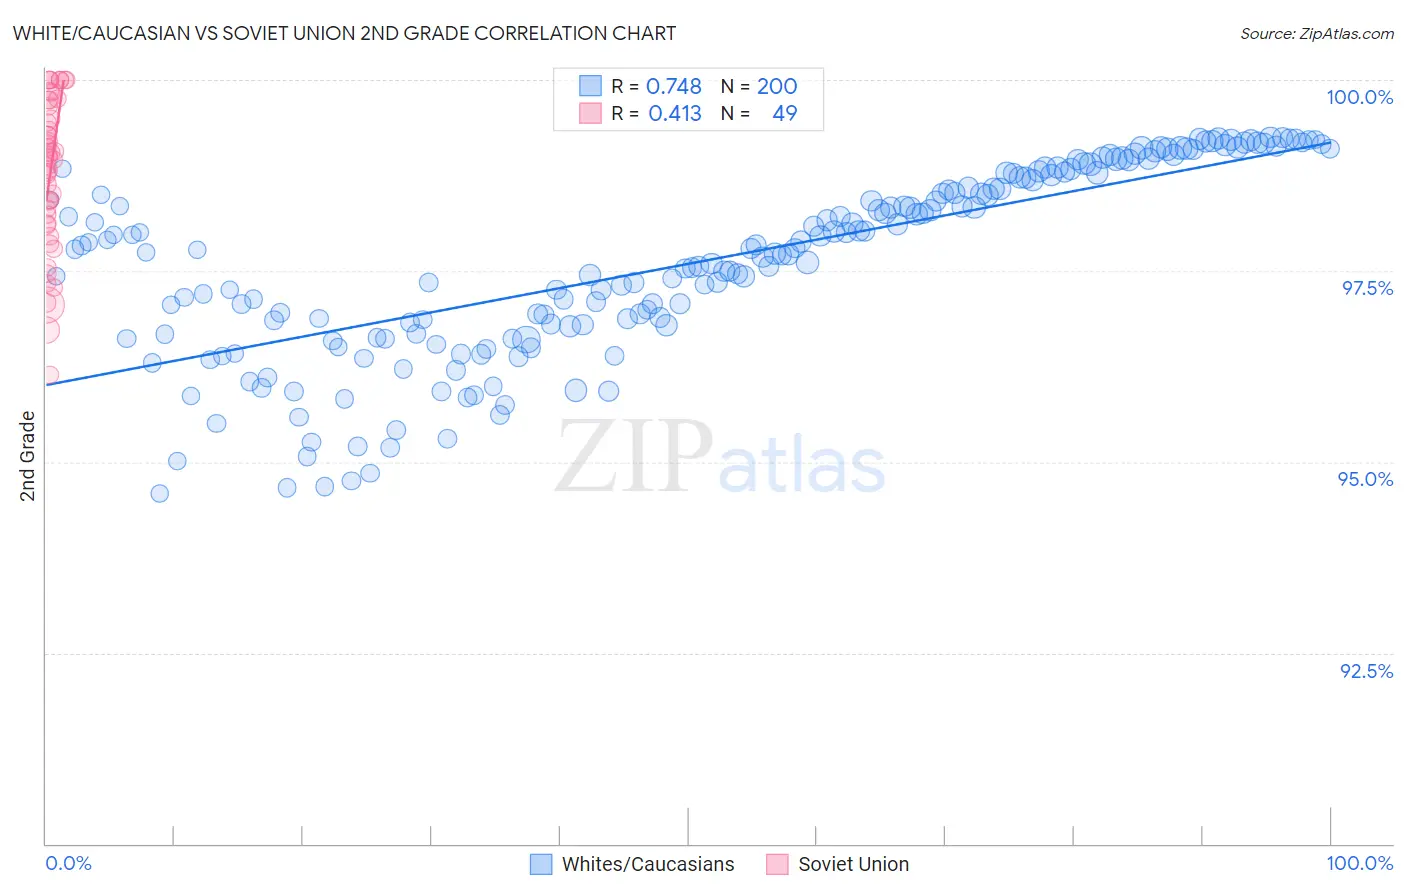
White/Caucasian vs Soviet Union 2nd Grade Correlation Chart
The statistical analysis conducted on geographies consisting of 585,247,393 people shows a strong positive correlation between the proportion of Whites/Caucasians and percentage of population with at least 2nd grade education in the United States with a correlation coefficient (R) of 0.748 and weighted average of 98.4%. Similarly, the statistical analysis conducted on geographies consisting of 43,454,395 people shows a moderate positive correlation between the proportion of Soviet Union and percentage of population with at least 2nd grade education in the United States with a correlation coefficient (R) of 0.413 and weighted average of 97.9%, a difference of 0.43%.
2nd Grade Correlation Summary
| Measurement | White/Caucasian | Soviet Union |
| Minimum | 94.6% | 96.1% |
| Maximum | 99.3% | 100.0% |
| Range | 4.7% | 3.9% |
| Mean | 97.6% | 98.8% |
| Median | 97.7% | 99.0% |
| Interquartile 25% (IQ1) | 96.7% | 98.1% |
| Interquartile 75% (IQ3) | 98.7% | 99.7% |
| Interquartile Range (IQR) | 2.1% | 1.6% |
| Standard Deviation (Sample) | 1.2% | 1.00% |
| Standard Deviation (Population) | 1.2% | 0.99% |
Similar Demographics by 2nd Grade
Demographics Similar to Whites/Caucasians by 2nd Grade
In terms of 2nd grade, the demographic groups most similar to Whites/Caucasians are Celtic (98.4%, a difference of 0.0%), Estonian (98.4%, a difference of 0.0%), Australian (98.4%, a difference of 0.0%), Czechoslovakian (98.4%, a difference of 0.010%), and Pueblo (98.3%, a difference of 0.010%).
| Demographics | Rating | Rank | 2nd Grade |
| Belgians | 99.9 /100 | #43 | Exceptional 98.4% |
| Northern Europeans | 99.9 /100 | #44 | Exceptional 98.4% |
| Hungarians | 99.9 /100 | #45 | Exceptional 98.4% |
| Lumbee | 99.9 /100 | #46 | Exceptional 98.4% |
| Ottawa | 99.9 /100 | #47 | Exceptional 98.4% |
| Czechoslovakians | 99.9 /100 | #48 | Exceptional 98.4% |
| Celtics | 99.8 /100 | #49 | Exceptional 98.4% |
| Whites/Caucasians | 99.8 /100 | #50 | Exceptional 98.4% |
| Estonians | 99.8 /100 | #51 | Exceptional 98.4% |
| Australians | 99.8 /100 | #52 | Exceptional 98.4% |
| Pueblo | 99.8 /100 | #53 | Exceptional 98.3% |
| Kiowa | 99.8 /100 | #54 | Exceptional 98.3% |
| Immigrants | Scotland | 99.8 /100 | #55 | Exceptional 98.3% |
| Americans | 99.8 /100 | #56 | Exceptional 98.3% |
| Austrians | 99.8 /100 | #57 | Exceptional 98.3% |
Demographics Similar to Soviet Union by 2nd Grade
In terms of 2nd grade, the demographic groups most similar to Soviet Union are Apache (97.9%, a difference of 0.010%), Immigrants from Moldova (97.9%, a difference of 0.010%), Immigrants from North Macedonia (97.9%, a difference of 0.010%), Immigrants from South Central Asia (97.9%, a difference of 0.010%), and Marshallese (97.9%, a difference of 0.010%).
| Demographics | Rating | Rank | 2nd Grade |
| Hmong | 80.0 /100 | #144 | Good 98.0% |
| Filipinos | 79.2 /100 | #145 | Good 98.0% |
| Immigrants | Israel | 78.0 /100 | #146 | Good 98.0% |
| Immigrants | Greece | 76.8 /100 | #147 | Good 98.0% |
| Jordanians | 74.5 /100 | #148 | Good 98.0% |
| Apache | 74.0 /100 | #149 | Good 97.9% |
| Immigrants | Moldova | 72.9 /100 | #150 | Good 97.9% |
| Soviet Union | 70.7 /100 | #151 | Good 97.9% |
| Immigrants | North Macedonia | 68.5 /100 | #152 | Good 97.9% |
| Immigrants | South Central Asia | 68.3 /100 | #153 | Good 97.9% |
| Marshallese | 67.7 /100 | #154 | Good 97.9% |
| French American Indians | 64.3 /100 | #155 | Good 97.9% |
| Dutch West Indians | 63.8 /100 | #156 | Good 97.9% |
| Venezuelans | 63.3 /100 | #157 | Good 97.9% |
| Immigrants | Iran | 62.8 /100 | #158 | Good 97.9% |