Immigrants from Asia vs Soviet Union 2nd Grade
COMPARE
Immigrants from Asia
Soviet Union
2nd Grade
2nd Grade Comparison
Immigrants from Asia
Soviet Union
97.5%
2ND GRADE
0.7/ 100
METRIC RATING
252nd/ 347
METRIC RANK
97.9%
2ND GRADE
70.7/ 100
METRIC RATING
151st/ 347
METRIC RANK
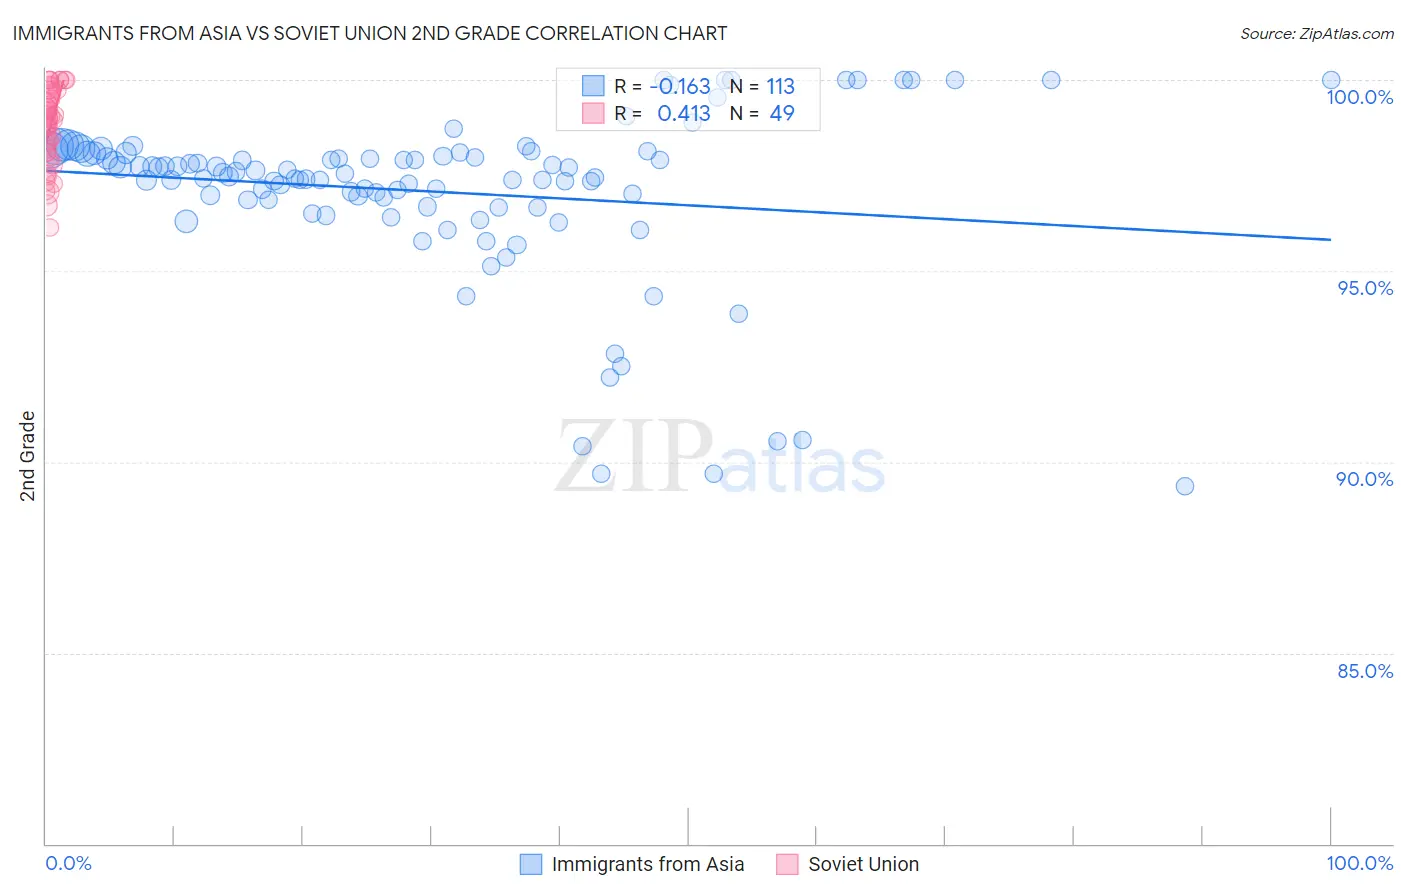
Immigrants from Asia vs Soviet Union 2nd Grade Correlation Chart
The statistical analysis conducted on geographies consisting of 549,170,546 people shows a poor negative correlation between the proportion of Immigrants from Asia and percentage of population with at least 2nd grade education in the United States with a correlation coefficient (R) of -0.163 and weighted average of 97.5%. Similarly, the statistical analysis conducted on geographies consisting of 43,454,395 people shows a moderate positive correlation between the proportion of Soviet Union and percentage of population with at least 2nd grade education in the United States with a correlation coefficient (R) of 0.413 and weighted average of 97.9%, a difference of 0.46%.
2nd Grade Correlation Summary
| Measurement | Immigrants from Asia | Soviet Union |
| Minimum | 89.4% | 96.1% |
| Maximum | 100.0% | 100.0% |
| Range | 10.6% | 3.9% |
| Mean | 97.1% | 98.8% |
| Median | 97.5% | 99.0% |
| Interquartile 25% (IQ1) | 96.8% | 98.1% |
| Interquartile 75% (IQ3) | 98.1% | 99.7% |
| Interquartile Range (IQR) | 1.3% | 1.6% |
| Standard Deviation (Sample) | 2.2% | 1.00% |
| Standard Deviation (Population) | 2.2% | 0.99% |
Similar Demographics by 2nd Grade
Demographics Similar to Immigrants from Asia by 2nd Grade
In terms of 2nd grade, the demographic groups most similar to Immigrants from Asia are Puerto Rican (97.5%, a difference of 0.0%), Peruvian (97.5%, a difference of 0.010%), Immigrants from Africa (97.5%, a difference of 0.010%), Indian (Asian) (97.5%, a difference of 0.010%), and Immigrants from Eastern Africa (97.5%, a difference of 0.020%).
| Demographics | Rating | Rank | 2nd Grade |
| Immigrants | Eastern Africa | 0.9 /100 | #245 | Tragic 97.5% |
| South Americans | 0.9 /100 | #246 | Tragic 97.5% |
| Immigrants | Senegal | 0.9 /100 | #247 | Tragic 97.5% |
| Immigrants | Middle Africa | 0.9 /100 | #248 | Tragic 97.5% |
| Bolivians | 0.9 /100 | #249 | Tragic 97.5% |
| Peruvians | 0.9 /100 | #250 | Tragic 97.5% |
| Immigrants | Africa | 0.8 /100 | #251 | Tragic 97.5% |
| Immigrants | Asia | 0.7 /100 | #252 | Tragic 97.5% |
| Puerto Ricans | 0.7 /100 | #253 | Tragic 97.5% |
| Indians (Asian) | 0.6 /100 | #254 | Tragic 97.5% |
| Immigrants | Congo | 0.6 /100 | #255 | Tragic 97.5% |
| Jamaicans | 0.6 /100 | #256 | Tragic 97.5% |
| Immigrants | Colombia | 0.5 /100 | #257 | Tragic 97.5% |
| Yaqui | 0.5 /100 | #258 | Tragic 97.5% |
| Fijians | 0.5 /100 | #259 | Tragic 97.5% |
Demographics Similar to Soviet Union by 2nd Grade
In terms of 2nd grade, the demographic groups most similar to Soviet Union are Apache (97.9%, a difference of 0.010%), Immigrants from Moldova (97.9%, a difference of 0.010%), Immigrants from North Macedonia (97.9%, a difference of 0.010%), Immigrants from South Central Asia (97.9%, a difference of 0.010%), and Marshallese (97.9%, a difference of 0.010%).
| Demographics | Rating | Rank | 2nd Grade |
| Hmong | 80.0 /100 | #144 | Good 98.0% |
| Filipinos | 79.2 /100 | #145 | Good 98.0% |
| Immigrants | Israel | 78.0 /100 | #146 | Good 98.0% |
| Immigrants | Greece | 76.8 /100 | #147 | Good 98.0% |
| Jordanians | 74.5 /100 | #148 | Good 98.0% |
| Apache | 74.0 /100 | #149 | Good 97.9% |
| Immigrants | Moldova | 72.9 /100 | #150 | Good 97.9% |
| Soviet Union | 70.7 /100 | #151 | Good 97.9% |
| Immigrants | North Macedonia | 68.5 /100 | #152 | Good 97.9% |
| Immigrants | South Central Asia | 68.3 /100 | #153 | Good 97.9% |
| Marshallese | 67.7 /100 | #154 | Good 97.9% |
| French American Indians | 64.3 /100 | #155 | Good 97.9% |
| Dutch West Indians | 63.8 /100 | #156 | Good 97.9% |
| Venezuelans | 63.3 /100 | #157 | Good 97.9% |
| Immigrants | Iran | 62.8 /100 | #158 | Good 97.9% |