Czechoslovakian vs Indonesian Associate's Degree
COMPARE
Czechoslovakian
Indonesian
Associate's Degree
Associate's Degree Comparison
Czechoslovakians
Indonesians
46.0%
ASSOCIATE'S DEGREE
40.0/ 100
METRIC RATING
184th/ 347
METRIC RANK
41.9%
ASSOCIATE'S DEGREE
0.6/ 100
METRIC RATING
253rd/ 347
METRIC RANK
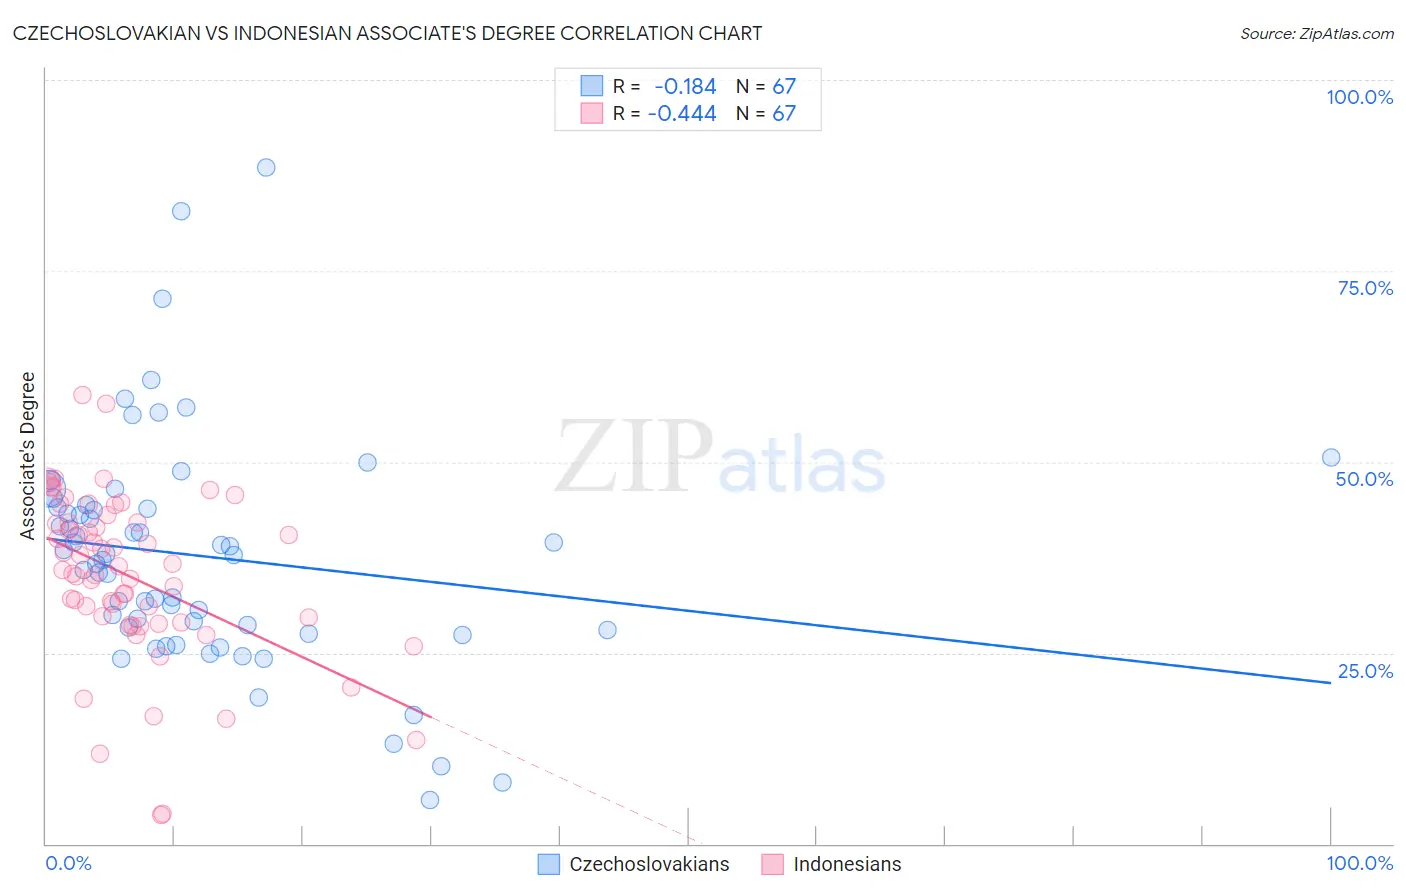
Czechoslovakian vs Indonesian Associate's Degree Correlation Chart
The statistical analysis conducted on geographies consisting of 368,660,591 people shows a poor negative correlation between the proportion of Czechoslovakians and percentage of population with at least associate's degree education in the United States with a correlation coefficient (R) of -0.184 and weighted average of 46.0%. Similarly, the statistical analysis conducted on geographies consisting of 162,722,822 people shows a moderate negative correlation between the proportion of Indonesians and percentage of population with at least associate's degree education in the United States with a correlation coefficient (R) of -0.444 and weighted average of 41.9%, a difference of 9.8%.
Associate's Degree Correlation Summary
| Measurement | Czechoslovakian | Indonesian |
| Minimum | 5.7% | 3.8% |
| Maximum | 88.6% | 58.7% |
| Range | 82.8% | 54.9% |
| Mean | 37.6% | 35.0% |
| Median | 37.8% | 35.9% |
| Interquartile 25% (IQ1) | 28.0% | 29.0% |
| Interquartile 75% (IQ3) | 44.1% | 42.1% |
| Interquartile Range (IQR) | 16.1% | 13.1% |
| Standard Deviation (Sample) | 15.1% | 11.0% |
| Standard Deviation (Population) | 15.0% | 10.9% |
Similar Demographics by Associate's Degree
Demographics Similar to Czechoslovakians by Associate's Degree
In terms of associate's degree, the demographic groups most similar to Czechoslovakians are Yugoslavian (46.0%, a difference of 0.020%), Swiss (46.0%, a difference of 0.030%), Immigrants from Colombia (46.0%, a difference of 0.10%), Costa Rican (46.0%, a difference of 0.11%), and Welsh (45.9%, a difference of 0.17%).
| Demographics | Rating | Rank | Associate's Degree |
| Slovaks | 48.4 /100 | #177 | Average 46.3% |
| Immigrants | Bosnia and Herzegovina | 48.3 /100 | #178 | Average 46.3% |
| Sri Lankans | 47.6 /100 | #179 | Average 46.3% |
| Bermudans | 46.4 /100 | #180 | Average 46.2% |
| Immigrants | Colombia | 41.3 /100 | #181 | Average 46.0% |
| Swiss | 40.4 /100 | #182 | Average 46.0% |
| Yugoslavians | 40.2 /100 | #183 | Average 46.0% |
| Czechoslovakians | 40.0 /100 | #184 | Average 46.0% |
| Costa Ricans | 38.6 /100 | #185 | Fair 46.0% |
| Welsh | 37.9 /100 | #186 | Fair 45.9% |
| Immigrants | Uruguay | 35.5 /100 | #187 | Fair 45.8% |
| Ghanaians | 35.5 /100 | #188 | Fair 45.8% |
| Immigrants | Oceania | 34.7 /100 | #189 | Fair 45.8% |
| Vietnamese | 34.0 /100 | #190 | Fair 45.8% |
| Koreans | 33.8 /100 | #191 | Fair 45.8% |
Demographics Similar to Indonesians by Associate's Degree
In terms of associate's degree, the demographic groups most similar to Indonesians are Cuban (41.9%, a difference of 0.060%), French American Indian (42.0%, a difference of 0.10%), Immigrants from Guyana (41.8%, a difference of 0.15%), Immigrants from Congo (41.8%, a difference of 0.28%), and Spanish American (41.8%, a difference of 0.34%).
| Demographics | Rating | Rank | Associate's Degree |
| Delaware | 0.9 /100 | #246 | Tragic 42.3% |
| Immigrants | Fiji | 0.8 /100 | #247 | Tragic 42.2% |
| Immigrants | Ecuador | 0.8 /100 | #248 | Tragic 42.2% |
| Jamaicans | 0.7 /100 | #249 | Tragic 42.1% |
| U.S. Virgin Islanders | 0.7 /100 | #250 | Tragic 42.1% |
| Immigrants | Bahamas | 0.7 /100 | #251 | Tragic 42.1% |
| French American Indians | 0.6 /100 | #252 | Tragic 42.0% |
| Indonesians | 0.6 /100 | #253 | Tragic 41.9% |
| Cubans | 0.6 /100 | #254 | Tragic 41.9% |
| Immigrants | Guyana | 0.5 /100 | #255 | Tragic 41.8% |
| Immigrants | Congo | 0.5 /100 | #256 | Tragic 41.8% |
| Spanish Americans | 0.5 /100 | #257 | Tragic 41.8% |
| Japanese | 0.5 /100 | #258 | Tragic 41.7% |
| Malaysians | 0.4 /100 | #259 | Tragic 41.6% |
| Marshallese | 0.4 /100 | #260 | Tragic 41.6% |