Cypriot vs Comanche 10th Grade
COMPARE
Cypriot
Comanche
10th Grade
10th Grade Comparison
Cypriots
Comanche
95.0%
10TH GRADE
99.8/ 100
METRIC RATING
60th/ 347
METRIC RANK
93.1%
10TH GRADE
4.9/ 100
METRIC RATING
233rd/ 347
METRIC RANK
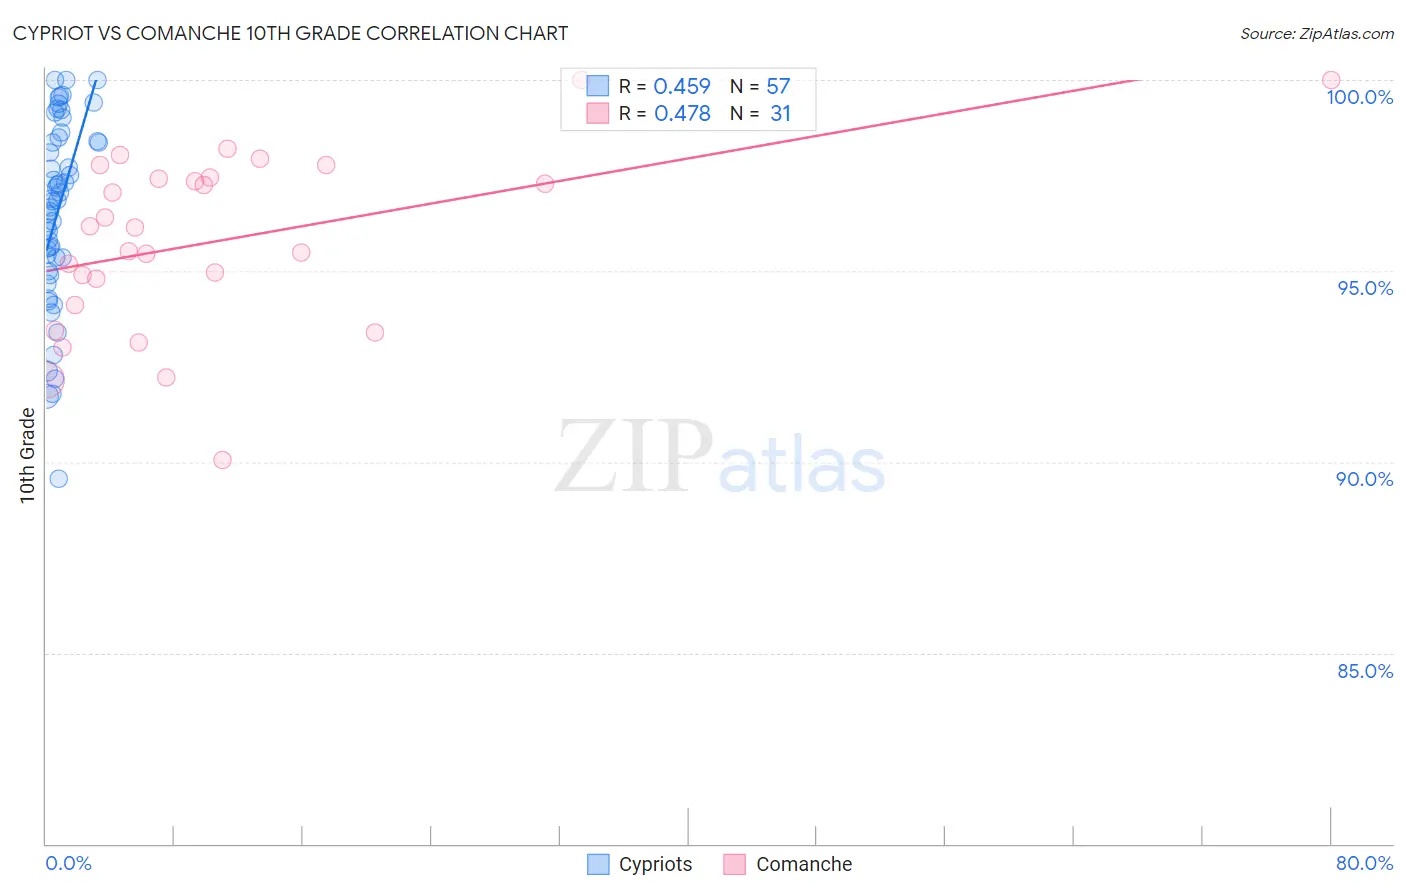
Cypriot vs Comanche 10th Grade Correlation Chart
The statistical analysis conducted on geographies consisting of 61,870,289 people shows a moderate positive correlation between the proportion of Cypriots and percentage of population with at least 10th grade education in the United States with a correlation coefficient (R) of 0.459 and weighted average of 95.0%. Similarly, the statistical analysis conducted on geographies consisting of 109,786,530 people shows a moderate positive correlation between the proportion of Comanche and percentage of population with at least 10th grade education in the United States with a correlation coefficient (R) of 0.478 and weighted average of 93.1%, a difference of 2.0%.
10th Grade Correlation Summary
| Measurement | Cypriot | Comanche |
| Minimum | 89.5% | 90.1% |
| Maximum | 100.0% | 100.0% |
| Range | 10.5% | 9.9% |
| Mean | 96.5% | 95.8% |
| Median | 96.8% | 96.1% |
| Interquartile 25% (IQ1) | 95.2% | 94.1% |
| Interquartile 75% (IQ3) | 98.4% | 97.4% |
| Interquartile Range (IQR) | 3.3% | 3.3% |
| Standard Deviation (Sample) | 2.4% | 2.3% |
| Standard Deviation (Population) | 2.4% | 2.3% |
Similar Demographics by 10th Grade
Demographics Similar to Cypriots by 10th Grade
In terms of 10th grade, the demographic groups most similar to Cypriots are Chippewa (95.0%, a difference of 0.0%), Aleut (95.0%, a difference of 0.010%), Celtic (95.0%, a difference of 0.010%), Thai (95.0%, a difference of 0.010%), and Immigrants from Singapore (95.0%, a difference of 0.010%).
| Demographics | Rating | Rank | 10th Grade |
| Immigrants | North America | 99.8 /100 | #53 | Exceptional 95.0% |
| Immigrants | Lithuania | 99.8 /100 | #54 | Exceptional 95.0% |
| Immigrants | Ireland | 99.8 /100 | #55 | Exceptional 95.0% |
| New Zealanders | 99.8 /100 | #56 | Exceptional 95.0% |
| Ukrainians | 99.8 /100 | #57 | Exceptional 95.0% |
| Aleuts | 99.8 /100 | #58 | Exceptional 95.0% |
| Celtics | 99.8 /100 | #59 | Exceptional 95.0% |
| Cypriots | 99.8 /100 | #60 | Exceptional 95.0% |
| Chippewa | 99.8 /100 | #61 | Exceptional 95.0% |
| Thais | 99.8 /100 | #62 | Exceptional 95.0% |
| Immigrants | Singapore | 99.8 /100 | #63 | Exceptional 95.0% |
| Native Hawaiians | 99.7 /100 | #64 | Exceptional 95.0% |
| Turks | 99.7 /100 | #65 | Exceptional 95.0% |
| Immigrants | Australia | 99.7 /100 | #66 | Exceptional 94.9% |
| Immigrants | Netherlands | 99.7 /100 | #67 | Exceptional 94.9% |
Demographics Similar to Comanche by 10th Grade
In terms of 10th grade, the demographic groups most similar to Comanche are South American Indian (93.1%, a difference of 0.0%), Bahamian (93.1%, a difference of 0.0%), Immigrants from Ethiopia (93.1%, a difference of 0.010%), Immigrants from Africa (93.1%, a difference of 0.010%), and Subsaharan African (93.1%, a difference of 0.010%).
| Demographics | Rating | Rank | 10th Grade |
| Koreans | 6.1 /100 | #226 | Tragic 93.2% |
| Blacks/African Americans | 6.0 /100 | #227 | Tragic 93.2% |
| Immigrants | China | 5.9 /100 | #228 | Tragic 93.2% |
| Immigrants | Ethiopia | 5.1 /100 | #229 | Tragic 93.1% |
| Immigrants | Africa | 5.0 /100 | #230 | Tragic 93.1% |
| South American Indians | 4.9 /100 | #231 | Tragic 93.1% |
| Bahamians | 4.9 /100 | #232 | Tragic 93.1% |
| Comanche | 4.9 /100 | #233 | Tragic 93.1% |
| Sub-Saharan Africans | 4.7 /100 | #234 | Tragic 93.1% |
| Africans | 4.6 /100 | #235 | Tragic 93.1% |
| Afghans | 4.5 /100 | #236 | Tragic 93.1% |
| Immigrants | Panama | 4.3 /100 | #237 | Tragic 93.1% |
| Nigerians | 4.2 /100 | #238 | Tragic 93.1% |
| Costa Ricans | 4.2 /100 | #239 | Tragic 93.1% |
| Immigrants | Hong Kong | 4.2 /100 | #240 | Tragic 93.1% |