Immigrants from Yemen vs Jordanian 10th Grade
COMPARE
Immigrants from Yemen
Jordanian
10th Grade
10th Grade Comparison
Immigrants from Yemen
Jordanians
89.1%
10TH GRADE
0.0/ 100
METRIC RATING
330th/ 347
METRIC RANK
94.4%
10TH GRADE
95.6/ 100
METRIC RATING
118th/ 347
METRIC RANK
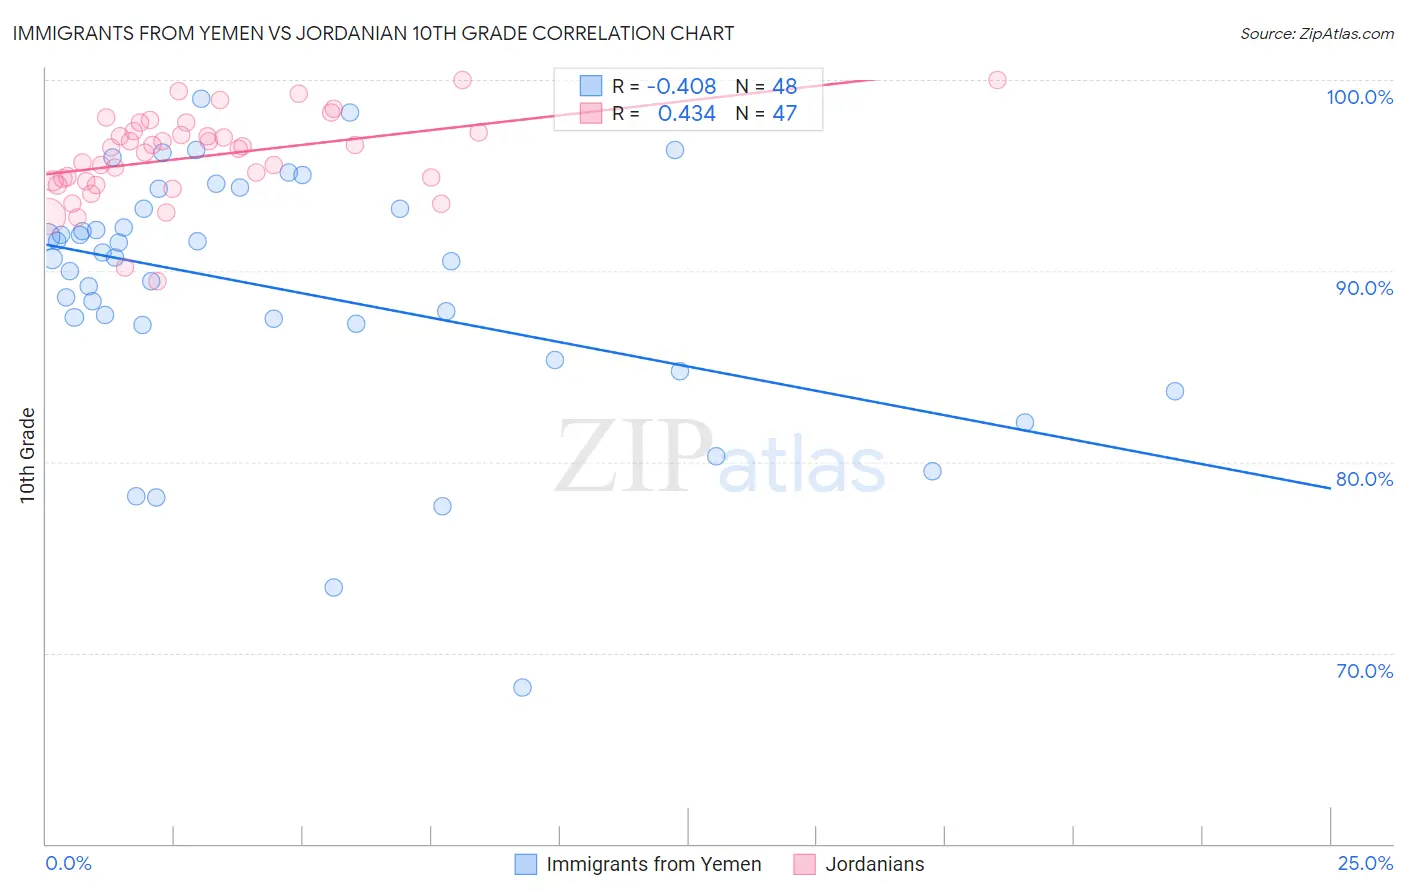
Immigrants from Yemen vs Jordanian 10th Grade Correlation Chart
The statistical analysis conducted on geographies consisting of 82,421,120 people shows a moderate negative correlation between the proportion of Immigrants from Yemen and percentage of population with at least 10th grade education in the United States with a correlation coefficient (R) of -0.408 and weighted average of 89.1%. Similarly, the statistical analysis conducted on geographies consisting of 166,402,085 people shows a moderate positive correlation between the proportion of Jordanians and percentage of population with at least 10th grade education in the United States with a correlation coefficient (R) of 0.434 and weighted average of 94.4%, a difference of 6.0%.
10th Grade Correlation Summary
| Measurement | Immigrants from Yemen | Jordanian |
| Minimum | 68.2% | 89.5% |
| Maximum | 99.0% | 100.0% |
| Range | 30.8% | 10.5% |
| Mean | 89.0% | 96.0% |
| Median | 90.7% | 96.4% |
| Interquartile 25% (IQ1) | 87.2% | 94.7% |
| Interquartile 75% (IQ3) | 93.3% | 97.3% |
| Interquartile Range (IQR) | 6.1% | 2.6% |
| Standard Deviation (Sample) | 6.5% | 2.3% |
| Standard Deviation (Population) | 6.5% | 2.2% |
Similar Demographics by 10th Grade
Demographics Similar to Immigrants from Yemen by 10th Grade
In terms of 10th grade, the demographic groups most similar to Immigrants from Yemen are Mexican American Indian (89.0%, a difference of 0.030%), Immigrants from the Azores (89.0%, a difference of 0.070%), Honduran (89.0%, a difference of 0.10%), Hispanic or Latino (88.9%, a difference of 0.22%), and Dominican (89.4%, a difference of 0.35%).
| Demographics | Rating | Rank | 10th Grade |
| Immigrants | Belize | 0.0 /100 | #323 | Tragic 90.1% |
| Immigrants | Armenia | 0.0 /100 | #324 | Tragic 89.9% |
| Puerto Ricans | 0.0 /100 | #325 | Tragic 89.8% |
| Central American Indians | 0.0 /100 | #326 | Tragic 89.7% |
| Immigrants | Nicaragua | 0.0 /100 | #327 | Tragic 89.5% |
| Immigrants | Cabo Verde | 0.0 /100 | #328 | Tragic 89.5% |
| Dominicans | 0.0 /100 | #329 | Tragic 89.4% |
| Immigrants | Yemen | 0.0 /100 | #330 | Tragic 89.1% |
| Mexican American Indians | 0.0 /100 | #331 | Tragic 89.0% |
| Immigrants | Azores | 0.0 /100 | #332 | Tragic 89.0% |
| Hondurans | 0.0 /100 | #333 | Tragic 89.0% |
| Hispanics or Latinos | 0.0 /100 | #334 | Tragic 88.9% |
| Immigrants | Dominican Republic | 0.0 /100 | #335 | Tragic 88.7% |
| Immigrants | Honduras | 0.0 /100 | #336 | Tragic 88.5% |
| Central Americans | 0.0 /100 | #337 | Tragic 88.4% |
Demographics Similar to Jordanians by 10th Grade
In terms of 10th grade, the demographic groups most similar to Jordanians are Immigrants from Hungary (94.4%, a difference of 0.010%), Immigrants from Israel (94.4%, a difference of 0.010%), Immigrants from Taiwan (94.4%, a difference of 0.010%), Immigrants from Belarus (94.4%, a difference of 0.020%), and Inupiat (94.4%, a difference of 0.020%).
| Demographics | Rating | Rank | 10th Grade |
| Immigrants | Zimbabwe | 96.8 /100 | #111 | Exceptional 94.4% |
| Immigrants | Kuwait | 96.8 /100 | #112 | Exceptional 94.4% |
| Palestinians | 96.5 /100 | #113 | Exceptional 94.4% |
| German Russians | 96.3 /100 | #114 | Exceptional 94.4% |
| Delaware | 96.3 /100 | #115 | Exceptional 94.4% |
| Sioux | 96.2 /100 | #116 | Exceptional 94.4% |
| Immigrants | Hungary | 95.8 /100 | #117 | Exceptional 94.4% |
| Jordanians | 95.6 /100 | #118 | Exceptional 94.4% |
| Immigrants | Israel | 95.4 /100 | #119 | Exceptional 94.4% |
| Immigrants | Taiwan | 95.3 /100 | #120 | Exceptional 94.4% |
| Immigrants | Belarus | 95.2 /100 | #121 | Exceptional 94.4% |
| Inupiat | 95.1 /100 | #122 | Exceptional 94.4% |
| Cree | 95.1 /100 | #123 | Exceptional 94.4% |
| Basques | 94.9 /100 | #124 | Exceptional 94.3% |
| Americans | 94.4 /100 | #125 | Exceptional 94.3% |