Cypriot vs Hispanic or Latino 10th Grade
COMPARE
Cypriot
Hispanic or Latino
10th Grade
10th Grade Comparison
Cypriots
Hispanics or Latinos
95.0%
10TH GRADE
99.8/ 100
METRIC RATING
60th/ 347
METRIC RANK
88.9%
10TH GRADE
0.0/ 100
METRIC RATING
334th/ 347
METRIC RANK
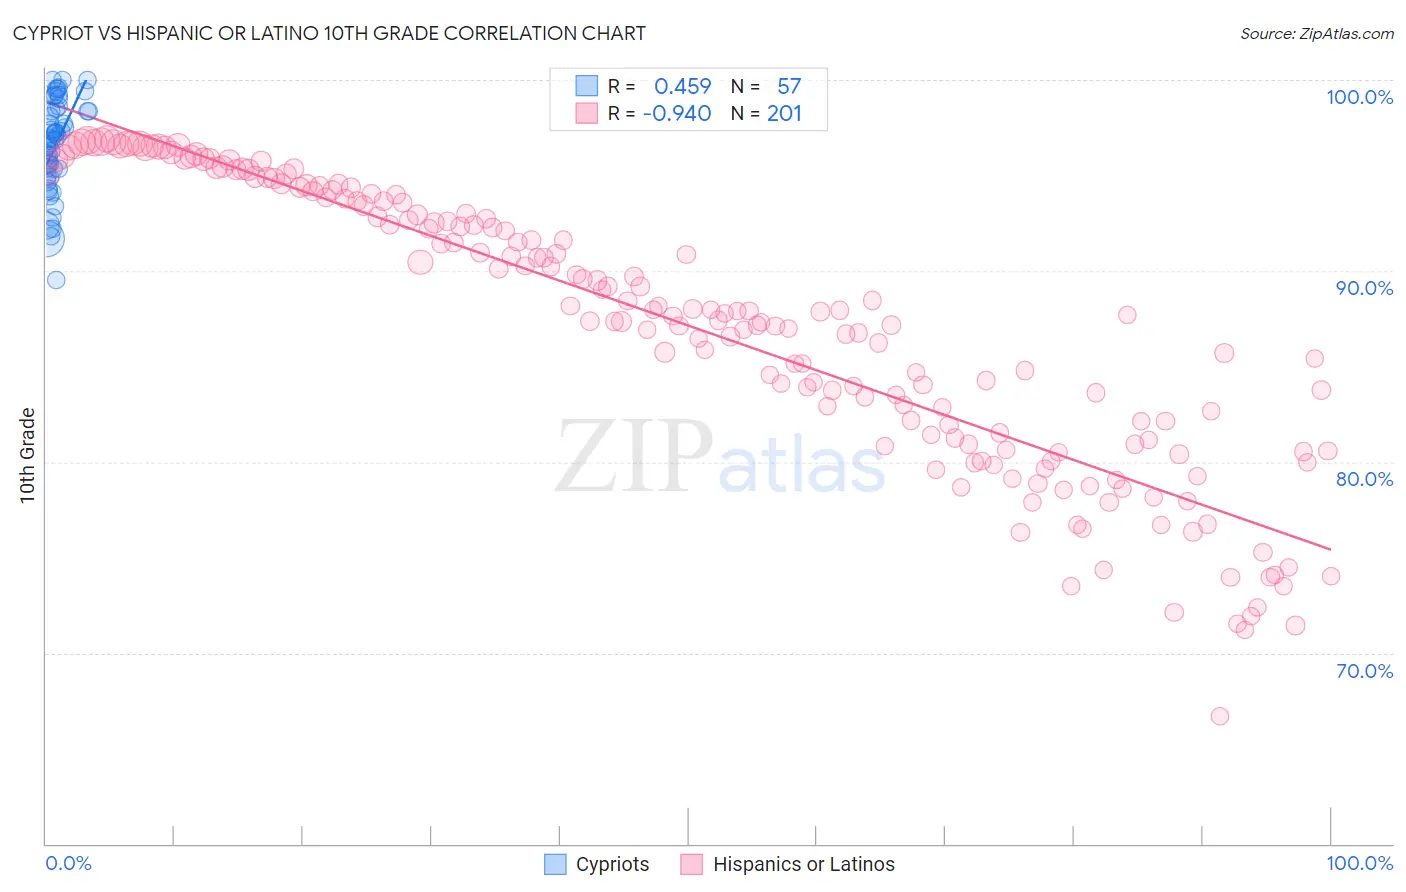
Cypriot vs Hispanic or Latino 10th Grade Correlation Chart
The statistical analysis conducted on geographies consisting of 61,870,289 people shows a moderate positive correlation between the proportion of Cypriots and percentage of population with at least 10th grade education in the United States with a correlation coefficient (R) of 0.459 and weighted average of 95.0%. Similarly, the statistical analysis conducted on geographies consisting of 578,613,916 people shows a near-perfect negative correlation between the proportion of Hispanics or Latinos and percentage of population with at least 10th grade education in the United States with a correlation coefficient (R) of -0.940 and weighted average of 88.9%, a difference of 6.9%.
10th Grade Correlation Summary
| Measurement | Cypriot | Hispanic or Latino |
| Minimum | 89.5% | 66.7% |
| Maximum | 100.0% | 96.9% |
| Range | 10.5% | 30.2% |
| Mean | 96.5% | 87.1% |
| Median | 96.8% | 87.8% |
| Interquartile 25% (IQ1) | 95.2% | 81.2% |
| Interquartile 75% (IQ3) | 98.4% | 93.7% |
| Interquartile Range (IQR) | 3.3% | 12.5% |
| Standard Deviation (Sample) | 2.4% | 7.3% |
| Standard Deviation (Population) | 2.4% | 7.2% |
Similar Demographics by 10th Grade
Demographics Similar to Cypriots by 10th Grade
In terms of 10th grade, the demographic groups most similar to Cypriots are Chippewa (95.0%, a difference of 0.0%), Aleut (95.0%, a difference of 0.010%), Celtic (95.0%, a difference of 0.010%), Thai (95.0%, a difference of 0.010%), and Immigrants from Singapore (95.0%, a difference of 0.010%).
| Demographics | Rating | Rank | 10th Grade |
| Immigrants | North America | 99.8 /100 | #53 | Exceptional 95.0% |
| Immigrants | Lithuania | 99.8 /100 | #54 | Exceptional 95.0% |
| Immigrants | Ireland | 99.8 /100 | #55 | Exceptional 95.0% |
| New Zealanders | 99.8 /100 | #56 | Exceptional 95.0% |
| Ukrainians | 99.8 /100 | #57 | Exceptional 95.0% |
| Aleuts | 99.8 /100 | #58 | Exceptional 95.0% |
| Celtics | 99.8 /100 | #59 | Exceptional 95.0% |
| Cypriots | 99.8 /100 | #60 | Exceptional 95.0% |
| Chippewa | 99.8 /100 | #61 | Exceptional 95.0% |
| Thais | 99.8 /100 | #62 | Exceptional 95.0% |
| Immigrants | Singapore | 99.8 /100 | #63 | Exceptional 95.0% |
| Native Hawaiians | 99.7 /100 | #64 | Exceptional 95.0% |
| Turks | 99.7 /100 | #65 | Exceptional 95.0% |
| Immigrants | Australia | 99.7 /100 | #66 | Exceptional 94.9% |
| Immigrants | Netherlands | 99.7 /100 | #67 | Exceptional 94.9% |
Demographics Similar to Hispanics or Latinos by 10th Grade
In terms of 10th grade, the demographic groups most similar to Hispanics or Latinos are Honduran (89.0%, a difference of 0.12%), Immigrants from the Azores (89.0%, a difference of 0.15%), Immigrants from Dominican Republic (88.7%, a difference of 0.18%), Mexican American Indian (89.0%, a difference of 0.19%), and Immigrants from Yemen (89.1%, a difference of 0.22%).
| Demographics | Rating | Rank | 10th Grade |
| Immigrants | Nicaragua | 0.0 /100 | #327 | Tragic 89.5% |
| Immigrants | Cabo Verde | 0.0 /100 | #328 | Tragic 89.5% |
| Dominicans | 0.0 /100 | #329 | Tragic 89.4% |
| Immigrants | Yemen | 0.0 /100 | #330 | Tragic 89.1% |
| Mexican American Indians | 0.0 /100 | #331 | Tragic 89.0% |
| Immigrants | Azores | 0.0 /100 | #332 | Tragic 89.0% |
| Hondurans | 0.0 /100 | #333 | Tragic 89.0% |
| Hispanics or Latinos | 0.0 /100 | #334 | Tragic 88.9% |
| Immigrants | Dominican Republic | 0.0 /100 | #335 | Tragic 88.7% |
| Immigrants | Honduras | 0.0 /100 | #336 | Tragic 88.5% |
| Central Americans | 0.0 /100 | #337 | Tragic 88.4% |
| Immigrants | Latin America | 0.0 /100 | #338 | Tragic 88.3% |
| Guatemalans | 0.0 /100 | #339 | Tragic 87.9% |
| Mexicans | 0.0 /100 | #340 | Tragic 87.8% |
| Salvadorans | 0.0 /100 | #341 | Tragic 87.5% |