Cypriot vs Okinawan Doctorate Degree
COMPARE
Cypriot
Okinawan
Doctorate Degree
Doctorate Degree Comparison
Cypriots
Okinawans
2.6%
DOCTORATE DEGREE
100.0/ 100
METRIC RATING
34th/ 347
METRIC RANK
3.3%
DOCTORATE DEGREE
100.0/ 100
METRIC RATING
3rd/ 347
METRIC RANK
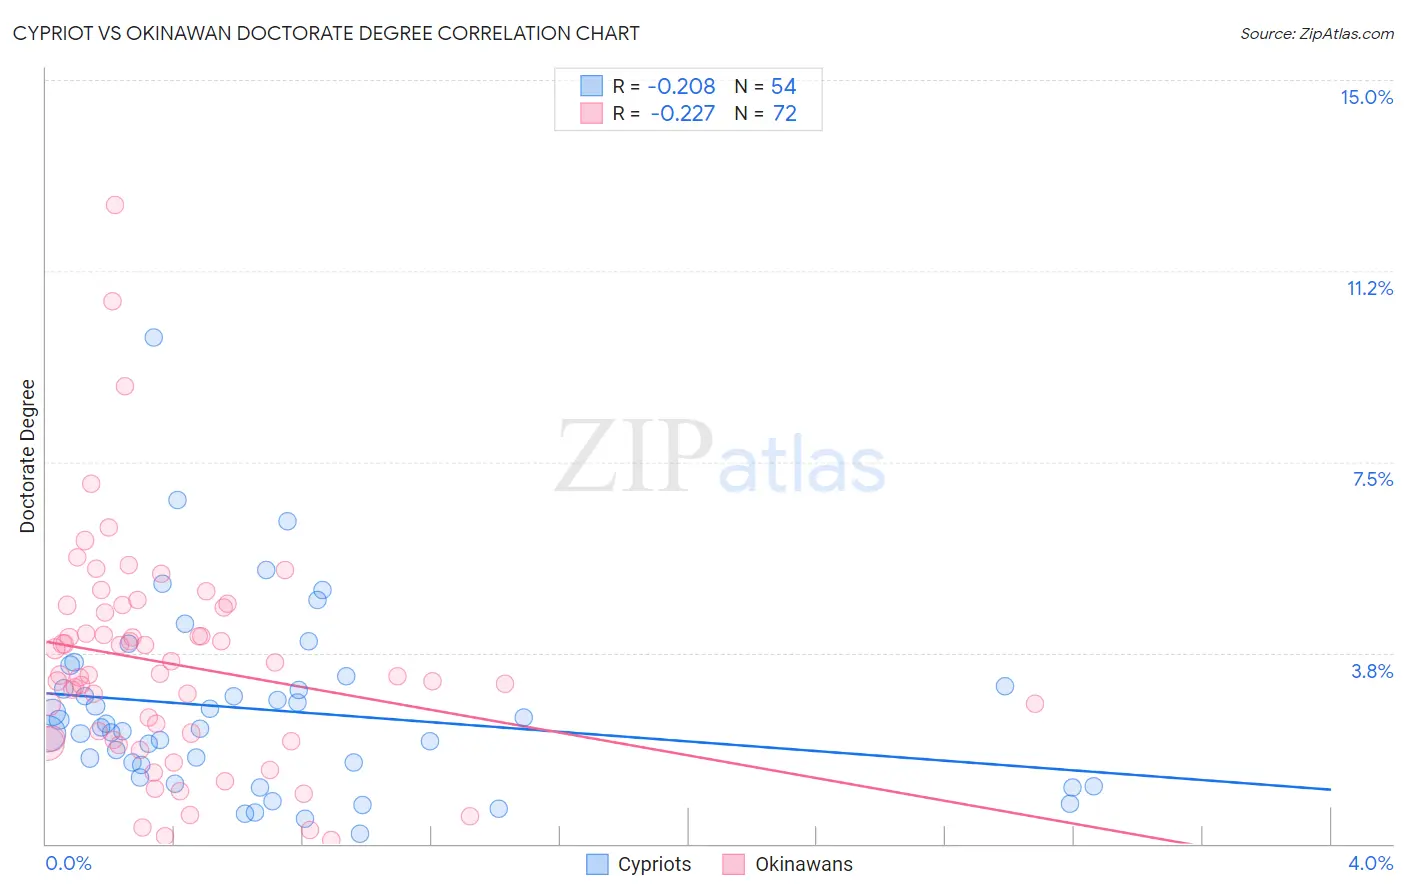
Cypriot vs Okinawan Doctorate Degree Correlation Chart
The statistical analysis conducted on geographies consisting of 61,785,676 people shows a weak negative correlation between the proportion of Cypriots and percentage of population with at least doctorate degree education in the United States with a correlation coefficient (R) of -0.208 and weighted average of 2.6%. Similarly, the statistical analysis conducted on geographies consisting of 73,671,875 people shows a weak negative correlation between the proportion of Okinawans and percentage of population with at least doctorate degree education in the United States with a correlation coefficient (R) of -0.227 and weighted average of 3.3%, a difference of 27.9%.
Doctorate Degree Correlation Summary
| Measurement | Cypriot | Okinawan |
| Minimum | 0.20% | 0.067% |
| Maximum | 9.9% | 12.6% |
| Range | 9.7% | 12.5% |
| Mean | 2.6% | 3.5% |
| Median | 2.3% | 3.3% |
| Interquartile 25% (IQ1) | 1.5% | 2.0% |
| Interquartile 75% (IQ3) | 3.1% | 4.6% |
| Interquartile Range (IQR) | 1.6% | 2.5% |
| Standard Deviation (Sample) | 1.8% | 2.2% |
| Standard Deviation (Population) | 1.8% | 2.2% |
Similar Demographics by Doctorate Degree
Demographics Similar to Cypriots by Doctorate Degree
In terms of doctorate degree, the demographic groups most similar to Cypriots are Immigrants from Malaysia (2.6%, a difference of 0.060%), Cambodian (2.6%, a difference of 0.11%), Immigrants from Spain (2.6%, a difference of 0.12%), Immigrants from Northern Europe (2.6%, a difference of 0.29%), and Immigrants from Kuwait (2.6%, a difference of 0.38%).
| Demographics | Rating | Rank | Doctorate Degree |
| Immigrants | Turkey | 100.0 /100 | #27 | Exceptional 2.6% |
| Burmese | 100.0 /100 | #28 | Exceptional 2.6% |
| Immigrants | South Central Asia | 100.0 /100 | #29 | Exceptional 2.6% |
| Immigrants | Korea | 100.0 /100 | #30 | Exceptional 2.6% |
| Latvians | 100.0 /100 | #31 | Exceptional 2.6% |
| Immigrants | Northern Europe | 100.0 /100 | #32 | Exceptional 2.6% |
| Cambodians | 100.0 /100 | #33 | Exceptional 2.6% |
| Cypriots | 100.0 /100 | #34 | Exceptional 2.6% |
| Immigrants | Malaysia | 100.0 /100 | #35 | Exceptional 2.6% |
| Immigrants | Spain | 100.0 /100 | #36 | Exceptional 2.6% |
| Immigrants | Kuwait | 100.0 /100 | #37 | Exceptional 2.6% |
| Russians | 100.0 /100 | #38 | Exceptional 2.6% |
| Immigrants | Ireland | 100.0 /100 | #39 | Exceptional 2.5% |
| Estonians | 100.0 /100 | #40 | Exceptional 2.5% |
| Immigrants | Russia | 100.0 /100 | #41 | Exceptional 2.5% |
Demographics Similar to Okinawans by Doctorate Degree
In terms of doctorate degree, the demographic groups most similar to Okinawans are Immigrants from Taiwan (3.2%, a difference of 2.6%), Iranian (3.1%, a difference of 4.2%), Filipino (3.4%, a difference of 4.7%), Immigrants from Switzerland (3.1%, a difference of 6.2%), and Immigrants from China (3.1%, a difference of 6.3%).
| Demographics | Rating | Rank | Doctorate Degree |
| Immigrants | Singapore | 100.0 /100 | #1 | Exceptional 3.7% |
| Filipinos | 100.0 /100 | #2 | Exceptional 3.4% |
| Okinawans | 100.0 /100 | #3 | Exceptional 3.3% |
| Immigrants | Taiwan | 100.0 /100 | #4 | Exceptional 3.2% |
| Iranians | 100.0 /100 | #5 | Exceptional 3.1% |
| Immigrants | Switzerland | 100.0 /100 | #6 | Exceptional 3.1% |
| Immigrants | China | 100.0 /100 | #7 | Exceptional 3.1% |
| Immigrants | Israel | 100.0 /100 | #8 | Exceptional 3.0% |
| Immigrants | Iran | 100.0 /100 | #9 | Exceptional 3.0% |
| Immigrants | Eastern Asia | 100.0 /100 | #10 | Exceptional 3.0% |
| Indians (Asian) | 100.0 /100 | #11 | Exceptional 2.9% |
| Immigrants | Belgium | 100.0 /100 | #12 | Exceptional 2.9% |
| Immigrants | Sweden | 100.0 /100 | #13 | Exceptional 2.9% |
| Immigrants | France | 100.0 /100 | #14 | Exceptional 2.9% |
| Immigrants | India | 100.0 /100 | #15 | Exceptional 2.8% |