Cypriot vs Immigrants from Cameroon 11th Grade
COMPARE
Cypriot
Immigrants from Cameroon
11th Grade
11th Grade Comparison
Cypriots
Immigrants from Cameroon
94.1%
11TH GRADE
99.9/ 100
METRIC RATING
41st/ 347
METRIC RANK
91.8%
11TH GRADE
4.4/ 100
METRIC RATING
227th/ 347
METRIC RANK
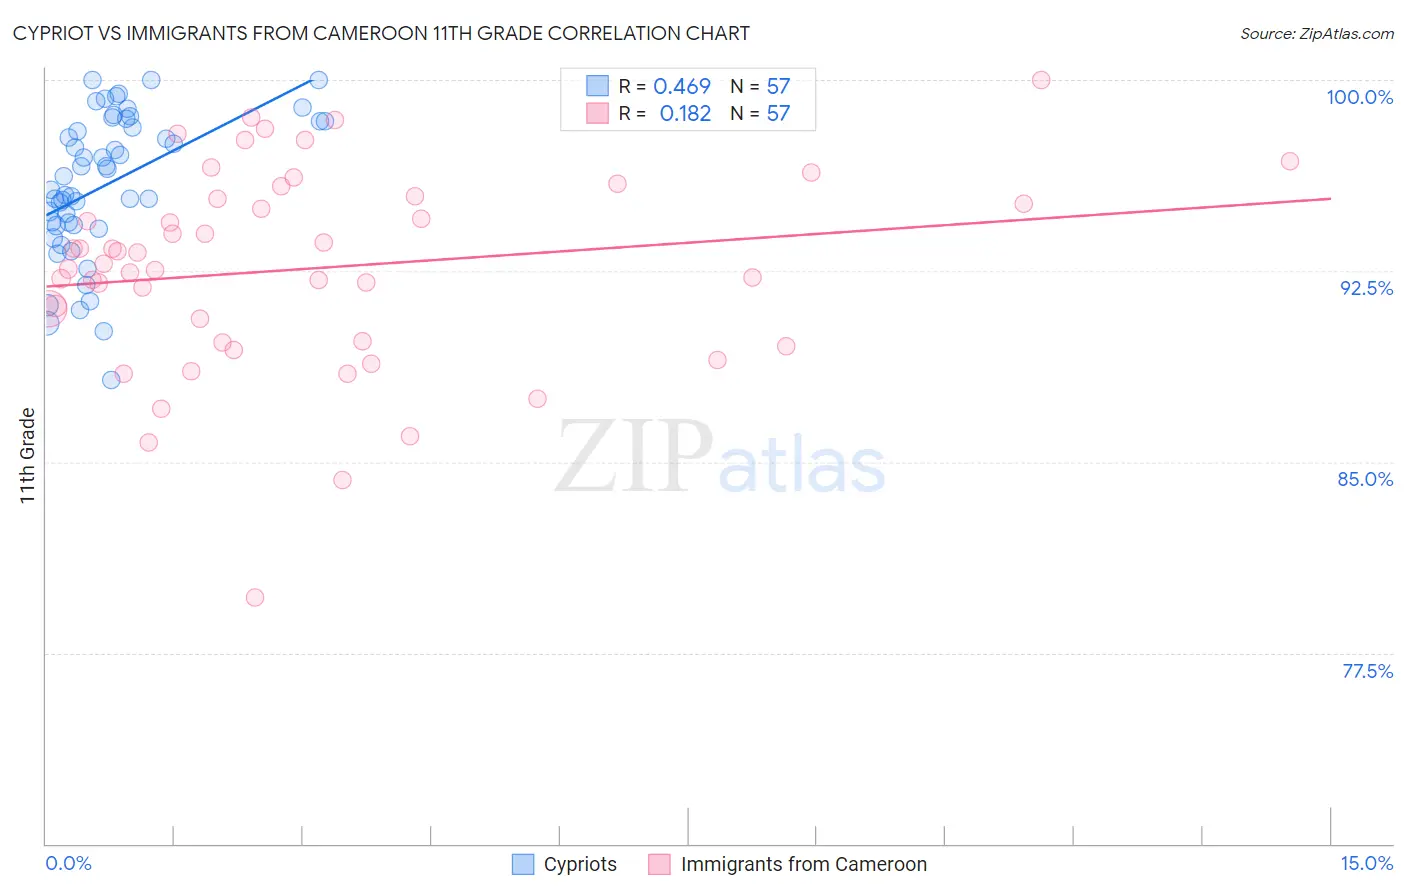
Cypriot vs Immigrants from Cameroon 11th Grade Correlation Chart
The statistical analysis conducted on geographies consisting of 61,870,289 people shows a moderate positive correlation between the proportion of Cypriots and percentage of population with at least 11th grade education in the United States with a correlation coefficient (R) of 0.469 and weighted average of 94.1%. Similarly, the statistical analysis conducted on geographies consisting of 130,618,704 people shows a poor positive correlation between the proportion of Immigrants from Cameroon and percentage of population with at least 11th grade education in the United States with a correlation coefficient (R) of 0.182 and weighted average of 91.8%, a difference of 2.5%.
11th Grade Correlation Summary
| Measurement | Cypriot | Immigrants from Cameroon |
| Minimum | 88.2% | 79.7% |
| Maximum | 100.0% | 100.0% |
| Range | 11.8% | 20.3% |
| Mean | 95.9% | 92.6% |
| Median | 96.2% | 92.8% |
| Interquartile 25% (IQ1) | 94.3% | 89.7% |
| Interquartile 75% (IQ3) | 98.4% | 95.4% |
| Interquartile Range (IQR) | 4.1% | 5.7% |
| Standard Deviation (Sample) | 2.8% | 3.9% |
| Standard Deviation (Population) | 2.8% | 3.9% |
Similar Demographics by 11th Grade
Demographics Similar to Cypriots by 11th Grade
In terms of 11th grade, the demographic groups most similar to Cypriots are Immigrants from Lithuania (94.1%, a difference of 0.010%), Thai (94.1%, a difference of 0.010%), Immigrants from Austria (94.1%, a difference of 0.010%), Greek (94.1%, a difference of 0.010%), and Immigrants from Ireland (94.1%, a difference of 0.020%).
| Demographics | Rating | Rank | 11th Grade |
| Immigrants | Scotland | 99.9 /100 | #34 | Exceptional 94.2% |
| Immigrants | Singapore | 99.9 /100 | #35 | Exceptional 94.2% |
| Immigrants | Northern Europe | 99.9 /100 | #36 | Exceptional 94.2% |
| Northern Europeans | 99.9 /100 | #37 | Exceptional 94.2% |
| Hungarians | 99.9 /100 | #38 | Exceptional 94.2% |
| Immigrants | Lithuania | 99.9 /100 | #39 | Exceptional 94.1% |
| Thais | 99.9 /100 | #40 | Exceptional 94.1% |
| Cypriots | 99.9 /100 | #41 | Exceptional 94.1% |
| Immigrants | Austria | 99.9 /100 | #42 | Exceptional 94.1% |
| Greeks | 99.9 /100 | #43 | Exceptional 94.1% |
| Immigrants | Ireland | 99.9 /100 | #44 | Exceptional 94.1% |
| Australians | 99.9 /100 | #45 | Exceptional 94.1% |
| Serbians | 99.9 /100 | #46 | Exceptional 94.1% |
| Filipinos | 99.9 /100 | #47 | Exceptional 94.1% |
| Macedonians | 99.9 /100 | #48 | Exceptional 94.1% |
Demographics Similar to Immigrants from Cameroon by 11th Grade
In terms of 11th grade, the demographic groups most similar to Immigrants from Cameroon are Immigrants from Panama (91.8%, a difference of 0.0%), Nigerian (91.8%, a difference of 0.010%), Immigrants from Afghanistan (91.8%, a difference of 0.030%), Choctaw (91.8%, a difference of 0.040%), and Immigrants from Somalia (91.9%, a difference of 0.050%).
| Demographics | Rating | Rank | 11th Grade |
| South American Indians | 7.6 /100 | #220 | Tragic 92.0% |
| Immigrants | Liberia | 7.0 /100 | #221 | Tragic 91.9% |
| Immigrants | Africa | 6.5 /100 | #222 | Tragic 91.9% |
| Immigrants | Bahamas | 6.5 /100 | #223 | Tragic 91.9% |
| Costa Ricans | 6.3 /100 | #224 | Tragic 91.9% |
| Immigrants | Zaire | 5.4 /100 | #225 | Tragic 91.9% |
| Immigrants | Somalia | 5.2 /100 | #226 | Tragic 91.9% |
| Immigrants | Cameroon | 4.4 /100 | #227 | Tragic 91.8% |
| Immigrants | Panama | 4.3 /100 | #228 | Tragic 91.8% |
| Nigerians | 4.3 /100 | #229 | Tragic 91.8% |
| Immigrants | Afghanistan | 3.9 /100 | #230 | Tragic 91.8% |
| Choctaw | 3.7 /100 | #231 | Tragic 91.8% |
| Uruguayans | 3.5 /100 | #232 | Tragic 91.8% |
| Cheyenne | 3.3 /100 | #233 | Tragic 91.8% |
| Armenians | 2.9 /100 | #234 | Tragic 91.7% |