Cypriot vs Guatemalan 11th Grade
COMPARE
Cypriot
Guatemalan
11th Grade
11th Grade Comparison
Cypriots
Guatemalans
94.1%
11TH GRADE
99.9/ 100
METRIC RATING
41st/ 347
METRIC RANK
86.4%
11TH GRADE
0.0/ 100
METRIC RATING
339th/ 347
METRIC RANK
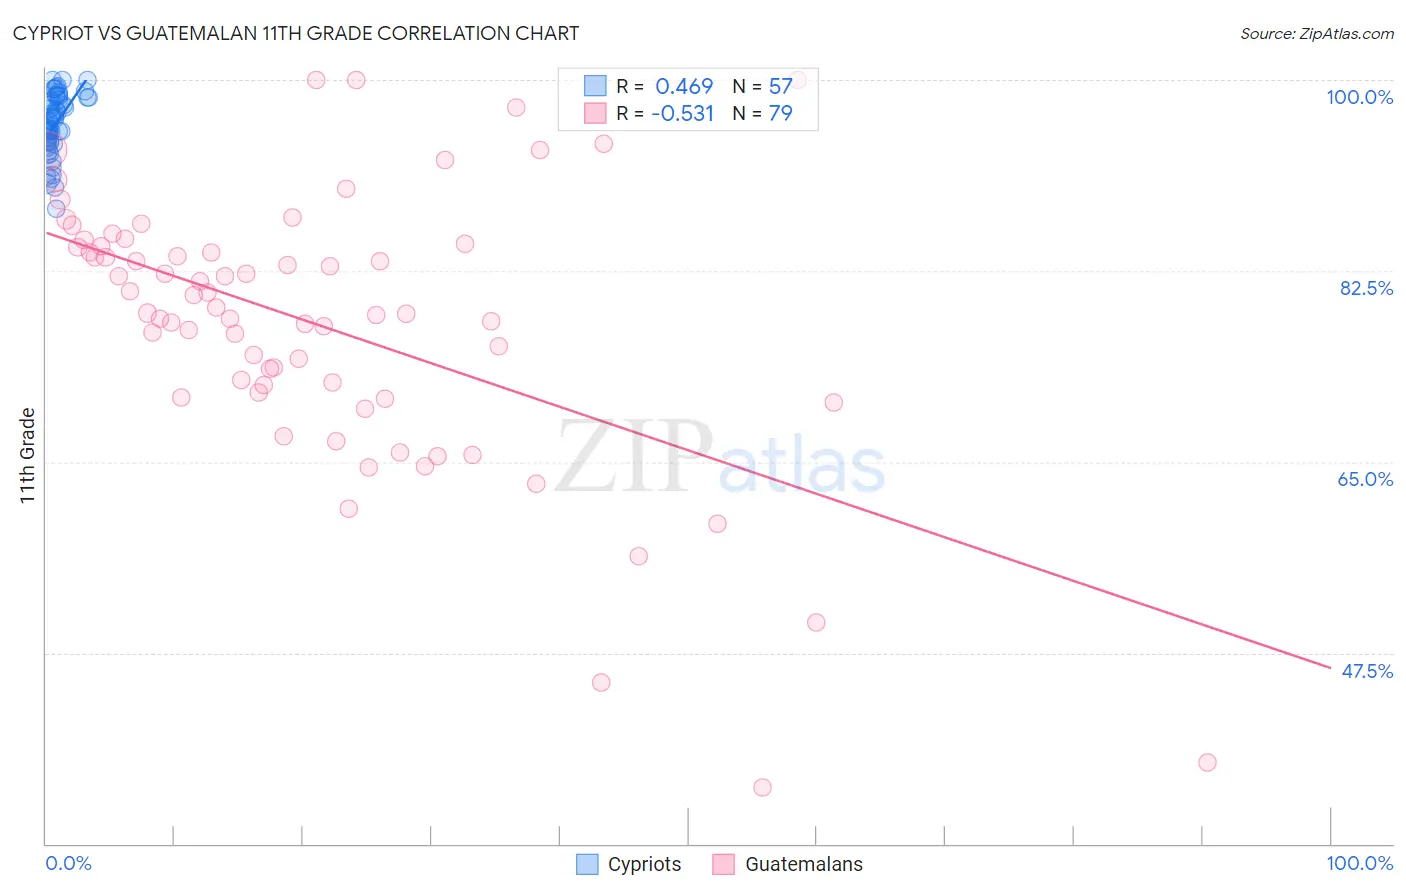
Cypriot vs Guatemalan 11th Grade Correlation Chart
The statistical analysis conducted on geographies consisting of 61,870,289 people shows a moderate positive correlation between the proportion of Cypriots and percentage of population with at least 11th grade education in the United States with a correlation coefficient (R) of 0.469 and weighted average of 94.1%. Similarly, the statistical analysis conducted on geographies consisting of 409,566,618 people shows a substantial negative correlation between the proportion of Guatemalans and percentage of population with at least 11th grade education in the United States with a correlation coefficient (R) of -0.531 and weighted average of 86.4%, a difference of 9.0%.
11th Grade Correlation Summary
| Measurement | Cypriot | Guatemalan |
| Minimum | 88.2% | 35.2% |
| Maximum | 100.0% | 100.0% |
| Range | 11.8% | 64.8% |
| Mean | 95.9% | 77.6% |
| Median | 96.2% | 78.6% |
| Interquartile 25% (IQ1) | 94.3% | 71.4% |
| Interquartile 75% (IQ3) | 98.4% | 84.8% |
| Interquartile Range (IQR) | 4.1% | 13.4% |
| Standard Deviation (Sample) | 2.8% | 12.6% |
| Standard Deviation (Population) | 2.8% | 12.5% |
Similar Demographics by 11th Grade
Demographics Similar to Cypriots by 11th Grade
In terms of 11th grade, the demographic groups most similar to Cypriots are Immigrants from Lithuania (94.1%, a difference of 0.010%), Thai (94.1%, a difference of 0.010%), Immigrants from Austria (94.1%, a difference of 0.010%), Greek (94.1%, a difference of 0.010%), and Immigrants from Ireland (94.1%, a difference of 0.020%).
| Demographics | Rating | Rank | 11th Grade |
| Immigrants | Scotland | 99.9 /100 | #34 | Exceptional 94.2% |
| Immigrants | Singapore | 99.9 /100 | #35 | Exceptional 94.2% |
| Immigrants | Northern Europe | 99.9 /100 | #36 | Exceptional 94.2% |
| Northern Europeans | 99.9 /100 | #37 | Exceptional 94.2% |
| Hungarians | 99.9 /100 | #38 | Exceptional 94.2% |
| Immigrants | Lithuania | 99.9 /100 | #39 | Exceptional 94.1% |
| Thais | 99.9 /100 | #40 | Exceptional 94.1% |
| Cypriots | 99.9 /100 | #41 | Exceptional 94.1% |
| Immigrants | Austria | 99.9 /100 | #42 | Exceptional 94.1% |
| Greeks | 99.9 /100 | #43 | Exceptional 94.1% |
| Immigrants | Ireland | 99.9 /100 | #44 | Exceptional 94.1% |
| Australians | 99.9 /100 | #45 | Exceptional 94.1% |
| Serbians | 99.9 /100 | #46 | Exceptional 94.1% |
| Filipinos | 99.9 /100 | #47 | Exceptional 94.1% |
| Macedonians | 99.9 /100 | #48 | Exceptional 94.1% |
Demographics Similar to Guatemalans by 11th Grade
In terms of 11th grade, the demographic groups most similar to Guatemalans are Salvadoran (86.2%, a difference of 0.23%), Mexican (86.1%, a difference of 0.29%), Immigrants from Latin America (86.8%, a difference of 0.49%), Immigrants from Honduras (86.9%, a difference of 0.61%), and Immigrants from Dominican Republic (86.9%, a difference of 0.62%).
| Demographics | Rating | Rank | 11th Grade |
| Immigrants | Azores | 0.0 /100 | #332 | Tragic 87.2% |
| Immigrants | Yemen | 0.0 /100 | #333 | Tragic 87.1% |
| Houma | 0.0 /100 | #334 | Tragic 87.0% |
| Central Americans | 0.0 /100 | #335 | Tragic 86.9% |
| Immigrants | Dominican Republic | 0.0 /100 | #336 | Tragic 86.9% |
| Immigrants | Honduras | 0.0 /100 | #337 | Tragic 86.9% |
| Immigrants | Latin America | 0.0 /100 | #338 | Tragic 86.8% |
| Guatemalans | 0.0 /100 | #339 | Tragic 86.4% |
| Salvadorans | 0.0 /100 | #340 | Tragic 86.2% |
| Mexicans | 0.0 /100 | #341 | Tragic 86.1% |
| Immigrants | Guatemala | 0.0 /100 | #342 | Tragic 85.8% |
| Immigrants | El Salvador | 0.0 /100 | #343 | Tragic 85.3% |
| Yakama | 0.0 /100 | #344 | Tragic 85.0% |
| Immigrants | Central America | 0.0 /100 | #345 | Tragic 84.9% |
| Spanish American Indians | 0.0 /100 | #346 | Tragic 84.7% |