Immigrants from Oceania vs Immigrants from Cameroon 11th Grade
COMPARE
Immigrants from Oceania
Immigrants from Cameroon
11th Grade
11th Grade Comparison
Immigrants from Oceania
Immigrants from Cameroon
92.2%
11TH GRADE
22.4/ 100
METRIC RATING
207th/ 347
METRIC RANK
91.8%
11TH GRADE
4.4/ 100
METRIC RATING
227th/ 347
METRIC RANK
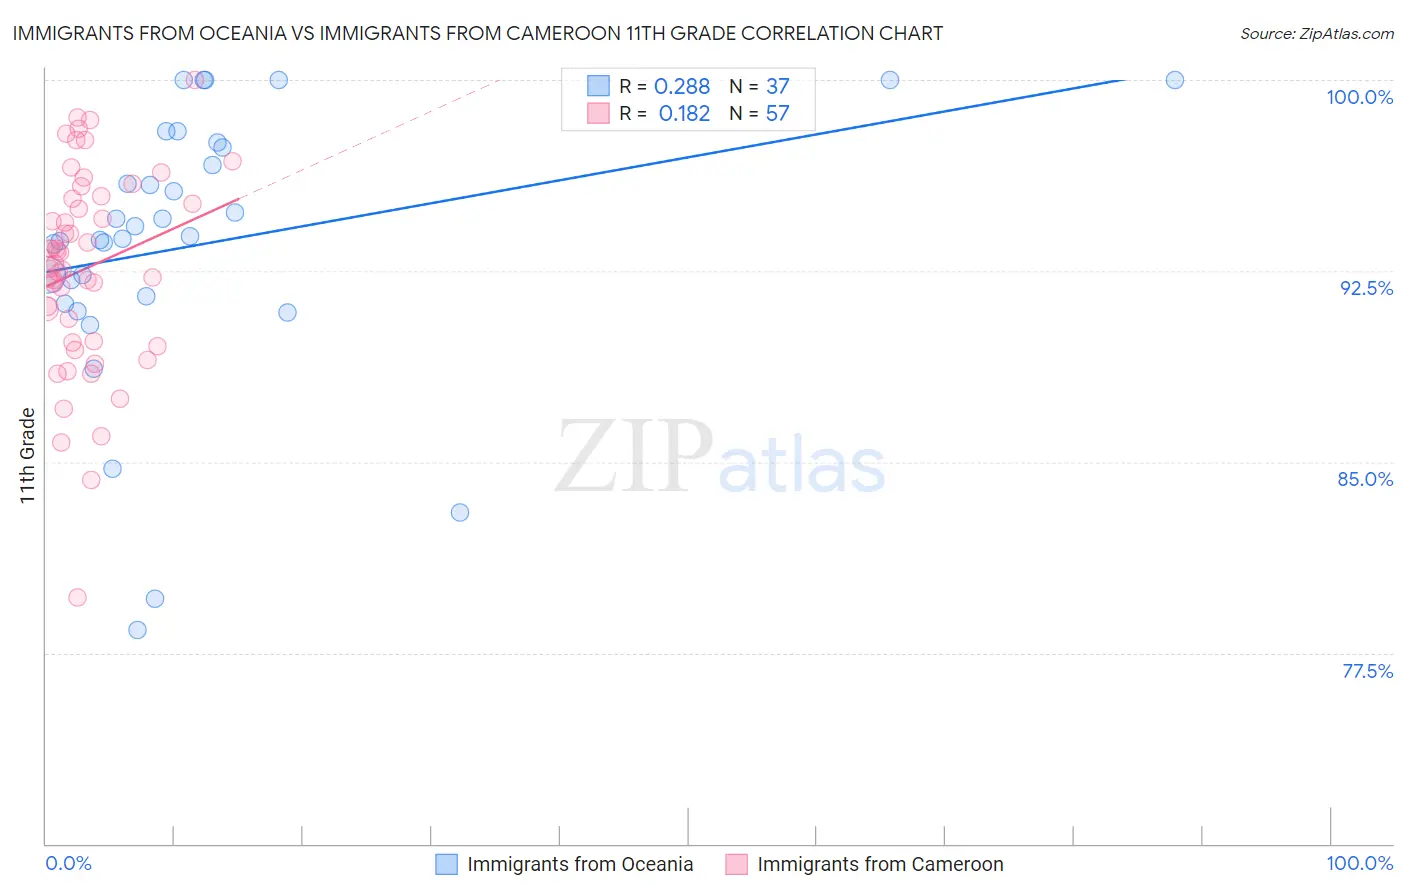
Immigrants from Oceania vs Immigrants from Cameroon 11th Grade Correlation Chart
The statistical analysis conducted on geographies consisting of 305,521,521 people shows a weak positive correlation between the proportion of Immigrants from Oceania and percentage of population with at least 11th grade education in the United States with a correlation coefficient (R) of 0.288 and weighted average of 92.2%. Similarly, the statistical analysis conducted on geographies consisting of 130,618,704 people shows a poor positive correlation between the proportion of Immigrants from Cameroon and percentage of population with at least 11th grade education in the United States with a correlation coefficient (R) of 0.182 and weighted average of 91.8%, a difference of 0.46%.
11th Grade Correlation Summary
| Measurement | Immigrants from Oceania | Immigrants from Cameroon |
| Minimum | 78.4% | 79.7% |
| Maximum | 100.0% | 100.0% |
| Range | 21.6% | 20.3% |
| Mean | 93.6% | 92.6% |
| Median | 93.8% | 92.8% |
| Interquartile 25% (IQ1) | 91.4% | 89.7% |
| Interquartile 75% (IQ3) | 97.5% | 95.4% |
| Interquartile Range (IQR) | 6.1% | 5.7% |
| Standard Deviation (Sample) | 5.3% | 3.9% |
| Standard Deviation (Population) | 5.3% | 3.9% |
Demographics Similar to Immigrants from Oceania and Immigrants from Cameroon by 11th Grade
In terms of 11th grade, the demographic groups most similar to Immigrants from Oceania are Colville (92.2%, a difference of 0.010%), Tongan (92.2%, a difference of 0.040%), Ethiopian (92.2%, a difference of 0.050%), Immigrants from Micronesia (92.2%, a difference of 0.070%), and Korean (92.1%, a difference of 0.13%). Similarly, the demographic groups most similar to Immigrants from Cameroon are Immigrants from Somalia (91.9%, a difference of 0.050%), Immigrants from Zaire (91.9%, a difference of 0.060%), Costa Rican (91.9%, a difference of 0.090%), Immigrants from Africa (91.9%, a difference of 0.10%), and Immigrants from Bahamas (91.9%, a difference of 0.10%).
| Demographics | Rating | Rank | 11th Grade |
| Immigrants | Oceania | 22.4 /100 | #207 | Fair 92.2% |
| Colville | 21.8 /100 | #208 | Fair 92.2% |
| Tongans | 19.8 /100 | #209 | Poor 92.2% |
| Ethiopians | 18.8 /100 | #210 | Poor 92.2% |
| Immigrants | Micronesia | 17.7 /100 | #211 | Poor 92.2% |
| Koreans | 14.4 /100 | #212 | Poor 92.1% |
| Immigrants | Ethiopia | 13.9 /100 | #213 | Poor 92.1% |
| Afghans | 12.8 /100 | #214 | Poor 92.1% |
| Immigrants | Southern Europe | 12.5 /100 | #215 | Poor 92.1% |
| Somalis | 11.6 /100 | #216 | Poor 92.1% |
| Immigrants | Sierra Leone | 11.1 /100 | #217 | Poor 92.0% |
| Blackfeet | 10.1 /100 | #218 | Poor 92.0% |
| Portuguese | 10.0 /100 | #219 | Tragic 92.0% |
| South American Indians | 7.6 /100 | #220 | Tragic 92.0% |
| Immigrants | Liberia | 7.0 /100 | #221 | Tragic 91.9% |
| Immigrants | Africa | 6.5 /100 | #222 | Tragic 91.9% |
| Immigrants | Bahamas | 6.5 /100 | #223 | Tragic 91.9% |
| Costa Ricans | 6.3 /100 | #224 | Tragic 91.9% |
| Immigrants | Zaire | 5.4 /100 | #225 | Tragic 91.9% |
| Immigrants | Somalia | 5.2 /100 | #226 | Tragic 91.9% |
| Immigrants | Cameroon | 4.4 /100 | #227 | Tragic 91.8% |