Cuban vs Shoshone Bachelor's Degree
COMPARE
Cuban
Shoshone
Bachelor's Degree
Bachelor's Degree Comparison
Cubans
Shoshone
32.5%
BACHELOR'S DEGREE
0.3/ 100
METRIC RATING
267th/ 347
METRIC RANK
29.3%
BACHELOR'S DEGREE
0.0/ 100
METRIC RATING
314th/ 347
METRIC RANK
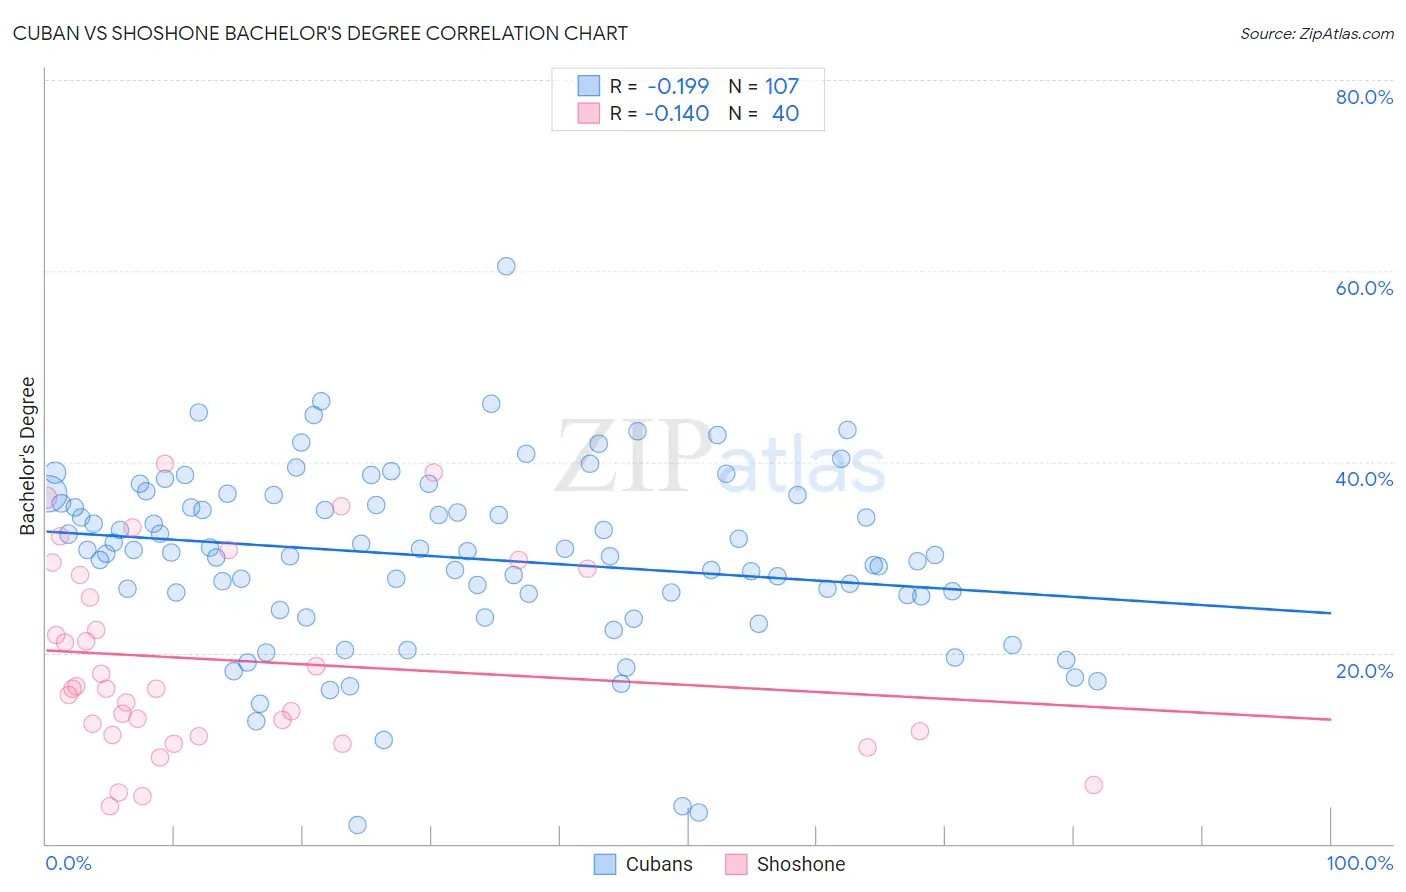
Cuban vs Shoshone Bachelor's Degree Correlation Chart
The statistical analysis conducted on geographies consisting of 449,220,145 people shows a poor negative correlation between the proportion of Cubans and percentage of population with at least bachelor's degree education in the United States with a correlation coefficient (R) of -0.199 and weighted average of 32.5%. Similarly, the statistical analysis conducted on geographies consisting of 66,627,292 people shows a poor negative correlation between the proportion of Shoshone and percentage of population with at least bachelor's degree education in the United States with a correlation coefficient (R) of -0.140 and weighted average of 29.3%, a difference of 11.0%.
Bachelor's Degree Correlation Summary
| Measurement | Cuban | Shoshone |
| Minimum | 2.0% | 4.0% |
| Maximum | 60.5% | 39.8% |
| Range | 58.5% | 35.9% |
| Mean | 30.0% | 19.2% |
| Median | 30.6% | 16.3% |
| Interquartile 25% (IQ1) | 25.9% | 11.6% |
| Interquartile 75% (IQ3) | 36.5% | 28.4% |
| Interquartile Range (IQR) | 10.6% | 16.8% |
| Standard Deviation (Sample) | 9.5% | 10.0% |
| Standard Deviation (Population) | 9.5% | 9.8% |
Similar Demographics by Bachelor's Degree
Demographics Similar to Cubans by Bachelor's Degree
In terms of bachelor's degree, the demographic groups most similar to Cubans are Immigrants from Dominica (32.5%, a difference of 0.12%), Bahamian (32.5%, a difference of 0.15%), Central American Indian (32.5%, a difference of 0.18%), Immigrants from Portugal (32.2%, a difference of 0.76%), and Belizean (32.8%, a difference of 0.96%).
| Demographics | Rating | Rank | Bachelor's Degree |
| Malaysians | 0.5 /100 | #260 | Tragic 32.9% |
| Africans | 0.5 /100 | #261 | Tragic 32.9% |
| Immigrants | Jamaica | 0.5 /100 | #262 | Tragic 32.9% |
| Belizeans | 0.4 /100 | #263 | Tragic 32.8% |
| Central American Indians | 0.3 /100 | #264 | Tragic 32.5% |
| Bahamians | 0.3 /100 | #265 | Tragic 32.5% |
| Immigrants | Dominica | 0.3 /100 | #266 | Tragic 32.5% |
| Cubans | 0.3 /100 | #267 | Tragic 32.5% |
| Immigrants | Portugal | 0.2 /100 | #268 | Tragic 32.2% |
| Immigrants | Belize | 0.2 /100 | #269 | Tragic 32.1% |
| Immigrants | Nicaragua | 0.2 /100 | #270 | Tragic 31.9% |
| Central Americans | 0.2 /100 | #271 | Tragic 31.9% |
| Comanche | 0.2 /100 | #272 | Tragic 31.9% |
| Americans | 0.2 /100 | #273 | Tragic 31.9% |
| Potawatomi | 0.2 /100 | #274 | Tragic 31.9% |
Demographics Similar to Shoshone by Bachelor's Degree
In terms of bachelor's degree, the demographic groups most similar to Shoshone are Immigrants from Cabo Verde (29.2%, a difference of 0.080%), Alaska Native (29.4%, a difference of 0.29%), Seminole (29.4%, a difference of 0.48%), Choctaw (29.4%, a difference of 0.53%), and Cheyenne (29.4%, a difference of 0.60%).
| Demographics | Rating | Rank | Bachelor's Degree |
| Nepalese | 0.0 /100 | #307 | Tragic 29.9% |
| Cajuns | 0.0 /100 | #308 | Tragic 29.6% |
| Hispanics or Latinos | 0.0 /100 | #309 | Tragic 29.6% |
| Cheyenne | 0.0 /100 | #310 | Tragic 29.4% |
| Choctaw | 0.0 /100 | #311 | Tragic 29.4% |
| Seminole | 0.0 /100 | #312 | Tragic 29.4% |
| Alaska Natives | 0.0 /100 | #313 | Tragic 29.4% |
| Shoshone | 0.0 /100 | #314 | Tragic 29.3% |
| Immigrants | Cabo Verde | 0.0 /100 | #315 | Tragic 29.2% |
| Sioux | 0.0 /100 | #316 | Tragic 29.1% |
| Colville | 0.0 /100 | #317 | Tragic 29.0% |
| Yaqui | 0.0 /100 | #318 | Tragic 29.0% |
| Creek | 0.0 /100 | #319 | Tragic 28.9% |
| Kiowa | 0.0 /100 | #320 | Tragic 28.8% |
| Alaskan Athabascans | 0.0 /100 | #321 | Tragic 28.8% |