Jamaican vs Shoshone Bachelor's Degree
COMPARE
Jamaican
Shoshone
Bachelor's Degree
Bachelor's Degree Comparison
Jamaicans
Shoshone
33.6%
BACHELOR'S DEGREE
1.0/ 100
METRIC RATING
246th/ 347
METRIC RANK
29.3%
BACHELOR'S DEGREE
0.0/ 100
METRIC RATING
314th/ 347
METRIC RANK
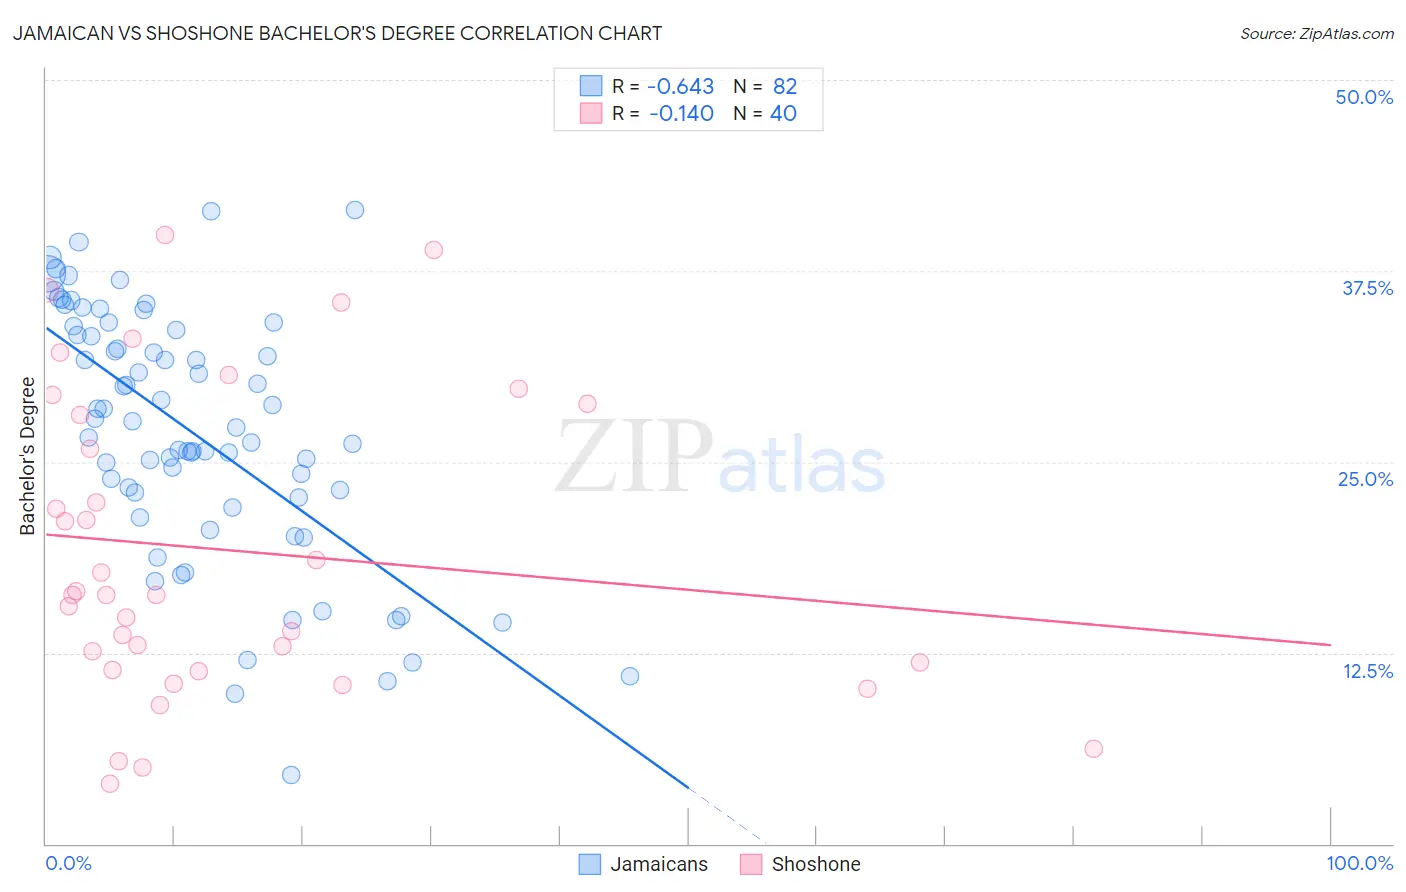
Jamaican vs Shoshone Bachelor's Degree Correlation Chart
The statistical analysis conducted on geographies consisting of 368,011,400 people shows a significant negative correlation between the proportion of Jamaicans and percentage of population with at least bachelor's degree education in the United States with a correlation coefficient (R) of -0.643 and weighted average of 33.6%. Similarly, the statistical analysis conducted on geographies consisting of 66,627,292 people shows a poor negative correlation between the proportion of Shoshone and percentage of population with at least bachelor's degree education in the United States with a correlation coefficient (R) of -0.140 and weighted average of 29.3%, a difference of 14.9%.
Bachelor's Degree Correlation Summary
| Measurement | Jamaican | Shoshone |
| Minimum | 4.5% | 4.0% |
| Maximum | 41.5% | 39.8% |
| Range | 37.0% | 35.9% |
| Mean | 27.0% | 19.2% |
| Median | 27.5% | 16.3% |
| Interquartile 25% (IQ1) | 22.7% | 11.6% |
| Interquartile 75% (IQ3) | 33.7% | 28.4% |
| Interquartile Range (IQR) | 11.0% | 16.8% |
| Standard Deviation (Sample) | 8.2% | 10.0% |
| Standard Deviation (Population) | 8.1% | 9.8% |
Similar Demographics by Bachelor's Degree
Demographics Similar to Jamaicans by Bachelor's Degree
In terms of bachelor's degree, the demographic groups most similar to Jamaicans are Immigrants from Congo (33.6%, a difference of 0.090%), Cree (33.6%, a difference of 0.10%), Immigrants from Liberia (33.5%, a difference of 0.23%), Indonesian (33.5%, a difference of 0.24%), and Immigrants from Fiji (33.7%, a difference of 0.36%).
| Demographics | Rating | Rank | Bachelor's Degree |
| British West Indians | 2.5 /100 | #239 | Tragic 34.5% |
| Tongans | 2.0 /100 | #240 | Tragic 34.3% |
| Immigrants | Cambodia | 1.9 /100 | #241 | Tragic 34.2% |
| Immigrants | Nonimmigrants | 1.8 /100 | #242 | Tragic 34.2% |
| Immigrants | Guyana | 1.4 /100 | #243 | Tragic 33.9% |
| Delaware | 1.2 /100 | #244 | Tragic 33.8% |
| Immigrants | Fiji | 1.2 /100 | #245 | Tragic 33.7% |
| Jamaicans | 1.0 /100 | #246 | Tragic 33.6% |
| Immigrants | Congo | 1.0 /100 | #247 | Tragic 33.6% |
| Cree | 1.0 /100 | #248 | Tragic 33.6% |
| Immigrants | Liberia | 0.9 /100 | #249 | Tragic 33.5% |
| Indonesians | 0.9 /100 | #250 | Tragic 33.5% |
| Japanese | 0.7 /100 | #251 | Tragic 33.3% |
| Immigrants | Bahamas | 0.7 /100 | #252 | Tragic 33.3% |
| U.S. Virgin Islanders | 0.7 /100 | #253 | Tragic 33.2% |
Demographics Similar to Shoshone by Bachelor's Degree
In terms of bachelor's degree, the demographic groups most similar to Shoshone are Immigrants from Cabo Verde (29.2%, a difference of 0.080%), Alaska Native (29.4%, a difference of 0.29%), Seminole (29.4%, a difference of 0.48%), Choctaw (29.4%, a difference of 0.53%), and Cheyenne (29.4%, a difference of 0.60%).
| Demographics | Rating | Rank | Bachelor's Degree |
| Nepalese | 0.0 /100 | #307 | Tragic 29.9% |
| Cajuns | 0.0 /100 | #308 | Tragic 29.6% |
| Hispanics or Latinos | 0.0 /100 | #309 | Tragic 29.6% |
| Cheyenne | 0.0 /100 | #310 | Tragic 29.4% |
| Choctaw | 0.0 /100 | #311 | Tragic 29.4% |
| Seminole | 0.0 /100 | #312 | Tragic 29.4% |
| Alaska Natives | 0.0 /100 | #313 | Tragic 29.4% |
| Shoshone | 0.0 /100 | #314 | Tragic 29.3% |
| Immigrants | Cabo Verde | 0.0 /100 | #315 | Tragic 29.2% |
| Sioux | 0.0 /100 | #316 | Tragic 29.1% |
| Colville | 0.0 /100 | #317 | Tragic 29.0% |
| Yaqui | 0.0 /100 | #318 | Tragic 29.0% |
| Creek | 0.0 /100 | #319 | Tragic 28.9% |
| Kiowa | 0.0 /100 | #320 | Tragic 28.8% |
| Alaskan Athabascans | 0.0 /100 | #321 | Tragic 28.8% |