Crow vs Immigrants from Norway Professional Degree
COMPARE
Crow
Immigrants from Norway
Professional Degree
Professional Degree Comparison
Crow
Immigrants from Norway
3.2%
PROFESSIONAL DEGREE
0.0/ 100
METRIC RATING
324th/ 347
METRIC RANK
6.0%
PROFESSIONAL DEGREE
100.0/ 100
METRIC RATING
38th/ 347
METRIC RANK
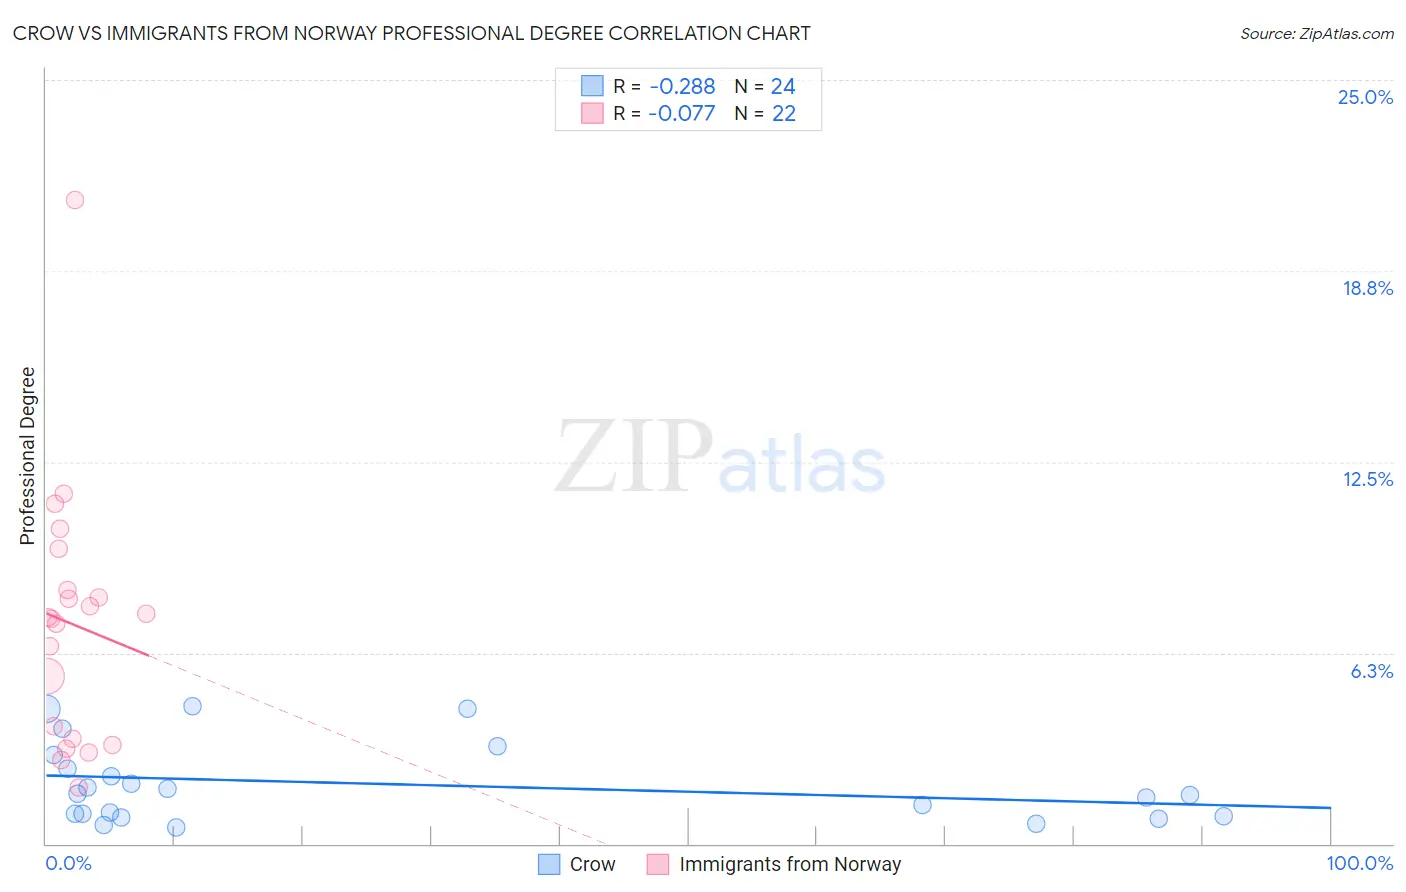
Crow vs Immigrants from Norway Professional Degree Correlation Chart
The statistical analysis conducted on geographies consisting of 59,107,625 people shows a weak negative correlation between the proportion of Crow and percentage of population with at least professional degree education in the United States with a correlation coefficient (R) of -0.288 and weighted average of 3.2%. Similarly, the statistical analysis conducted on geographies consisting of 116,643,848 people shows a slight negative correlation between the proportion of Immigrants from Norway and percentage of population with at least professional degree education in the United States with a correlation coefficient (R) of -0.077 and weighted average of 6.0%, a difference of 90.3%.
Professional Degree Correlation Summary
| Measurement | Crow | Immigrants from Norway |
| Minimum | 0.53% | 1.9% |
| Maximum | 4.5% | 21.1% |
| Range | 4.0% | 19.2% |
| Mean | 2.0% | 7.2% |
| Median | 1.6% | 7.4% |
| Interquartile 25% (IQ1) | 0.93% | 3.4% |
| Interquartile 75% (IQ3) | 2.7% | 8.3% |
| Interquartile Range (IQR) | 1.7% | 4.9% |
| Standard Deviation (Sample) | 1.3% | 4.2% |
| Standard Deviation (Population) | 1.3% | 4.1% |
Similar Demographics by Professional Degree
Demographics Similar to Crow by Professional Degree
In terms of professional degree, the demographic groups most similar to Crow are Yaqui (3.2%, a difference of 0.060%), Inupiat (3.2%, a difference of 0.27%), Hispanic or Latino (3.2%, a difference of 0.35%), Tsimshian (3.2%, a difference of 0.72%), and Seminole (3.2%, a difference of 1.1%).
| Demographics | Rating | Rank | Professional Degree |
| Nepalese | 0.1 /100 | #317 | Tragic 3.2% |
| Immigrants | Micronesia | 0.1 /100 | #318 | Tragic 3.2% |
| Choctaw | 0.1 /100 | #319 | Tragic 3.2% |
| Seminole | 0.1 /100 | #320 | Tragic 3.2% |
| Tsimshian | 0.0 /100 | #321 | Tragic 3.2% |
| Hispanics or Latinos | 0.0 /100 | #322 | Tragic 3.2% |
| Inupiat | 0.0 /100 | #323 | Tragic 3.2% |
| Crow | 0.0 /100 | #324 | Tragic 3.2% |
| Yaqui | 0.0 /100 | #325 | Tragic 3.2% |
| Menominee | 0.0 /100 | #326 | Tragic 3.1% |
| Dutch West Indians | 0.0 /100 | #327 | Tragic 3.1% |
| Creek | 0.0 /100 | #328 | Tragic 3.1% |
| Bangladeshis | 0.0 /100 | #329 | Tragic 3.1% |
| Immigrants | Cabo Verde | 0.0 /100 | #330 | Tragic 3.1% |
| Kiowa | 0.0 /100 | #331 | Tragic 3.1% |
Demographics Similar to Immigrants from Norway by Professional Degree
In terms of professional degree, the demographic groups most similar to Immigrants from Norway are Immigrants from Austria (6.0%, a difference of 0.20%), Immigrants from South Africa (6.0%, a difference of 0.25%), Immigrants from Russia (6.0%, a difference of 0.51%), Cambodian (6.0%, a difference of 0.73%), and New Zealander (6.0%, a difference of 0.91%).
| Demographics | Rating | Rank | Professional Degree |
| Immigrants | India | 100.0 /100 | #31 | Exceptional 6.2% |
| Thais | 100.0 /100 | #32 | Exceptional 6.1% |
| Burmese | 100.0 /100 | #33 | Exceptional 6.1% |
| Mongolians | 100.0 /100 | #34 | Exceptional 6.1% |
| Immigrants | Korea | 100.0 /100 | #35 | Exceptional 6.1% |
| Immigrants | Russia | 100.0 /100 | #36 | Exceptional 6.0% |
| Immigrants | Austria | 100.0 /100 | #37 | Exceptional 6.0% |
| Immigrants | Norway | 100.0 /100 | #38 | Exceptional 6.0% |
| Immigrants | South Africa | 100.0 /100 | #39 | Exceptional 6.0% |
| Cambodians | 100.0 /100 | #40 | Exceptional 6.0% |
| New Zealanders | 100.0 /100 | #41 | Exceptional 6.0% |
| Estonians | 100.0 /100 | #42 | Exceptional 6.0% |
| Immigrants | Saudi Arabia | 100.0 /100 | #43 | Exceptional 5.9% |
| Argentineans | 100.0 /100 | #44 | Exceptional 5.9% |
| Immigrants | South Central Asia | 100.0 /100 | #45 | Exceptional 5.9% |