Russian vs Immigrants from Norway Professional Degree
COMPARE
Russian
Immigrants from Norway
Professional Degree
Professional Degree Comparison
Russians
Immigrants from Norway
6.3%
PROFESSIONAL DEGREE
100.0/ 100
METRIC RATING
23rd/ 347
METRIC RANK
6.0%
PROFESSIONAL DEGREE
100.0/ 100
METRIC RATING
38th/ 347
METRIC RANK
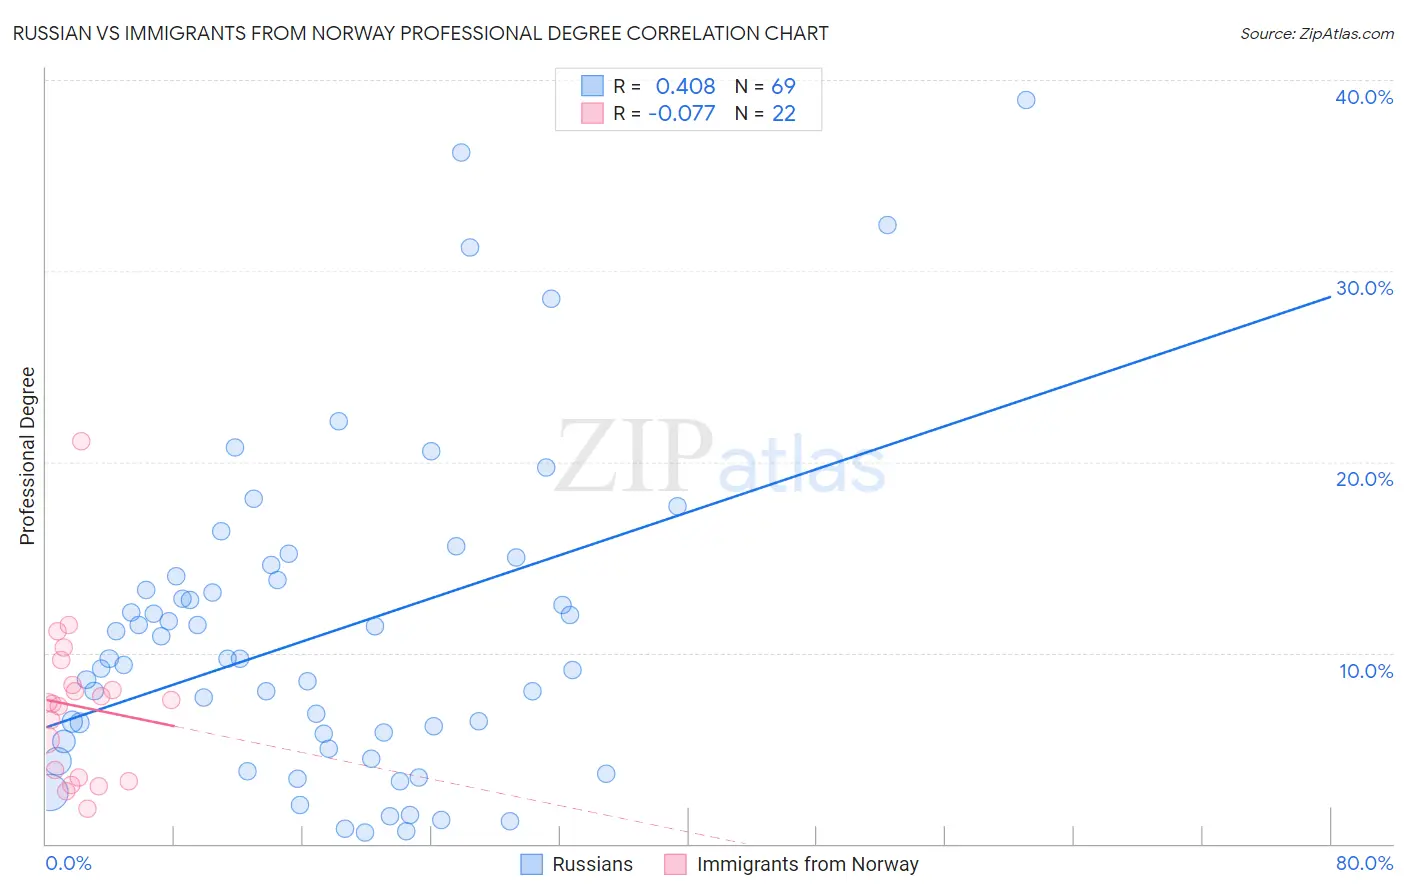
Russian vs Immigrants from Norway Professional Degree Correlation Chart
The statistical analysis conducted on geographies consisting of 509,341,332 people shows a moderate positive correlation between the proportion of Russians and percentage of population with at least professional degree education in the United States with a correlation coefficient (R) of 0.408 and weighted average of 6.3%. Similarly, the statistical analysis conducted on geographies consisting of 116,643,848 people shows a slight negative correlation between the proportion of Immigrants from Norway and percentage of population with at least professional degree education in the United States with a correlation coefficient (R) of -0.077 and weighted average of 6.0%, a difference of 5.4%.
Professional Degree Correlation Summary
| Measurement | Russian | Immigrants from Norway |
| Minimum | 0.56% | 1.9% |
| Maximum | 39.0% | 21.1% |
| Range | 38.4% | 19.2% |
| Mean | 11.0% | 7.2% |
| Median | 9.7% | 7.4% |
| Interquartile 25% (IQ1) | 5.2% | 3.4% |
| Interquartile 75% (IQ3) | 13.9% | 8.3% |
| Interquartile Range (IQR) | 8.7% | 4.9% |
| Standard Deviation (Sample) | 8.3% | 4.2% |
| Standard Deviation (Population) | 8.3% | 4.1% |
Demographics Similar to Russians and Immigrants from Norway by Professional Degree
In terms of professional degree, the demographic groups most similar to Russians are Immigrants from Spain (6.3%, a difference of 0.040%), Immigrants from Japan (6.4%, a difference of 0.48%), Immigrants from Ireland (6.3%, a difference of 0.53%), Immigrants from Hong Kong (6.4%, a difference of 1.2%), and Latvian (6.2%, a difference of 1.4%). Similarly, the demographic groups most similar to Immigrants from Norway are Immigrants from Austria (6.0%, a difference of 0.20%), Immigrants from South Africa (6.0%, a difference of 0.25%), Immigrants from Russia (6.0%, a difference of 0.51%), Cambodian (6.0%, a difference of 0.73%), and Immigrants from Korea (6.1%, a difference of 1.4%).
| Demographics | Rating | Rank | Professional Degree |
| Immigrants | Denmark | 100.0 /100 | #20 | Exceptional 6.4% |
| Immigrants | Hong Kong | 100.0 /100 | #21 | Exceptional 6.4% |
| Immigrants | Japan | 100.0 /100 | #22 | Exceptional 6.4% |
| Russians | 100.0 /100 | #23 | Exceptional 6.3% |
| Immigrants | Spain | 100.0 /100 | #24 | Exceptional 6.3% |
| Immigrants | Ireland | 100.0 /100 | #25 | Exceptional 6.3% |
| Latvians | 100.0 /100 | #26 | Exceptional 6.2% |
| Immigrants | Northern Europe | 100.0 /100 | #27 | Exceptional 6.2% |
| Turks | 100.0 /100 | #28 | Exceptional 6.2% |
| Immigrants | Sri Lanka | 100.0 /100 | #29 | Exceptional 6.2% |
| Immigrants | Turkey | 100.0 /100 | #30 | Exceptional 6.2% |
| Immigrants | India | 100.0 /100 | #31 | Exceptional 6.2% |
| Thais | 100.0 /100 | #32 | Exceptional 6.1% |
| Burmese | 100.0 /100 | #33 | Exceptional 6.1% |
| Mongolians | 100.0 /100 | #34 | Exceptional 6.1% |
| Immigrants | Korea | 100.0 /100 | #35 | Exceptional 6.1% |
| Immigrants | Russia | 100.0 /100 | #36 | Exceptional 6.0% |
| Immigrants | Austria | 100.0 /100 | #37 | Exceptional 6.0% |
| Immigrants | Norway | 100.0 /100 | #38 | Exceptional 6.0% |
| Immigrants | South Africa | 100.0 /100 | #39 | Exceptional 6.0% |
| Cambodians | 100.0 /100 | #40 | Exceptional 6.0% |