Swiss vs Immigrants from Norway Professional Degree
COMPARE
Swiss
Immigrants from Norway
Professional Degree
Professional Degree Comparison
Swiss
Immigrants from Norway
4.5%
PROFESSIONAL DEGREE
61.0/ 100
METRIC RATING
164th/ 347
METRIC RANK
6.0%
PROFESSIONAL DEGREE
100.0/ 100
METRIC RATING
38th/ 347
METRIC RANK
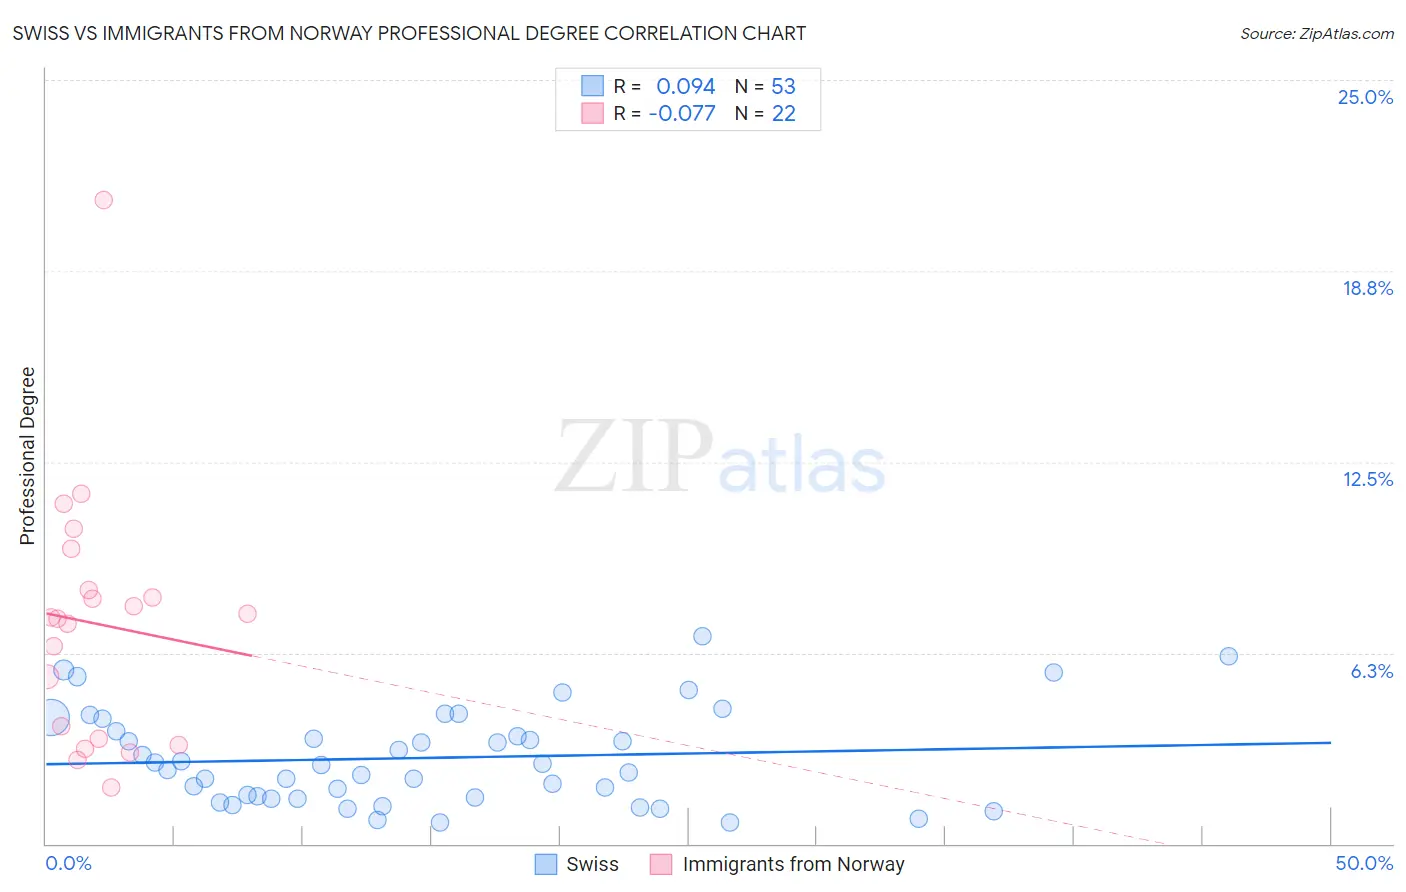
Swiss vs Immigrants from Norway Professional Degree Correlation Chart
The statistical analysis conducted on geographies consisting of 462,554,590 people shows a slight positive correlation between the proportion of Swiss and percentage of population with at least professional degree education in the United States with a correlation coefficient (R) of 0.094 and weighted average of 4.5%. Similarly, the statistical analysis conducted on geographies consisting of 116,643,848 people shows a slight negative correlation between the proportion of Immigrants from Norway and percentage of population with at least professional degree education in the United States with a correlation coefficient (R) of -0.077 and weighted average of 6.0%, a difference of 34.2%.
Professional Degree Correlation Summary
| Measurement | Swiss | Immigrants from Norway |
| Minimum | 0.69% | 1.9% |
| Maximum | 6.8% | 21.1% |
| Range | 6.1% | 19.2% |
| Mean | 2.8% | 7.2% |
| Median | 2.6% | 7.4% |
| Interquartile 25% (IQ1) | 1.5% | 3.4% |
| Interquartile 75% (IQ3) | 3.9% | 8.3% |
| Interquartile Range (IQR) | 2.4% | 4.9% |
| Standard Deviation (Sample) | 1.5% | 4.2% |
| Standard Deviation (Population) | 1.5% | 4.1% |
Similar Demographics by Professional Degree
Demographics Similar to Swiss by Professional Degree
In terms of professional degree, the demographic groups most similar to Swiss are Costa Rican (4.5%, a difference of 0.17%), Immigrants from Colombia (4.5%, a difference of 0.24%), Immigrants from Afghanistan (4.5%, a difference of 0.27%), Immigrants from Sierra Leone (4.5%, a difference of 0.34%), and Chinese (4.5%, a difference of 0.36%).
| Demographics | Rating | Rank | Professional Degree |
| Iraqis | 69.8 /100 | #157 | Good 4.5% |
| Immigrants | Armenia | 68.8 /100 | #158 | Good 4.5% |
| Vietnamese | 68.4 /100 | #159 | Good 4.5% |
| Immigrants | Senegal | 68.0 /100 | #160 | Good 4.5% |
| Assyrians/Chaldeans/Syriacs | 67.4 /100 | #161 | Good 4.5% |
| Peruvians | 65.2 /100 | #162 | Good 4.5% |
| Sierra Leoneans | 64.3 /100 | #163 | Good 4.5% |
| Swiss | 61.0 /100 | #164 | Good 4.5% |
| Costa Ricans | 59.9 /100 | #165 | Average 4.5% |
| Immigrants | Colombia | 59.4 /100 | #166 | Average 4.5% |
| Immigrants | Afghanistan | 59.2 /100 | #167 | Average 4.5% |
| Immigrants | Sierra Leone | 58.7 /100 | #168 | Average 4.5% |
| Chinese | 58.6 /100 | #169 | Average 4.5% |
| Immigrants | Zaire | 57.4 /100 | #170 | Average 4.5% |
| Immigrants | Bangladesh | 56.0 /100 | #171 | Average 4.4% |
Demographics Similar to Immigrants from Norway by Professional Degree
In terms of professional degree, the demographic groups most similar to Immigrants from Norway are Immigrants from Austria (6.0%, a difference of 0.20%), Immigrants from South Africa (6.0%, a difference of 0.25%), Immigrants from Russia (6.0%, a difference of 0.51%), Cambodian (6.0%, a difference of 0.73%), and New Zealander (6.0%, a difference of 0.91%).
| Demographics | Rating | Rank | Professional Degree |
| Immigrants | India | 100.0 /100 | #31 | Exceptional 6.2% |
| Thais | 100.0 /100 | #32 | Exceptional 6.1% |
| Burmese | 100.0 /100 | #33 | Exceptional 6.1% |
| Mongolians | 100.0 /100 | #34 | Exceptional 6.1% |
| Immigrants | Korea | 100.0 /100 | #35 | Exceptional 6.1% |
| Immigrants | Russia | 100.0 /100 | #36 | Exceptional 6.0% |
| Immigrants | Austria | 100.0 /100 | #37 | Exceptional 6.0% |
| Immigrants | Norway | 100.0 /100 | #38 | Exceptional 6.0% |
| Immigrants | South Africa | 100.0 /100 | #39 | Exceptional 6.0% |
| Cambodians | 100.0 /100 | #40 | Exceptional 6.0% |
| New Zealanders | 100.0 /100 | #41 | Exceptional 6.0% |
| Estonians | 100.0 /100 | #42 | Exceptional 6.0% |
| Immigrants | Saudi Arabia | 100.0 /100 | #43 | Exceptional 5.9% |
| Argentineans | 100.0 /100 | #44 | Exceptional 5.9% |
| Immigrants | South Central Asia | 100.0 /100 | #45 | Exceptional 5.9% |