Tohono O'odham vs Immigrants from India 7th Grade

COMPARE

Tohono O'odham
Race
Ancestry
AfghanAfricanAlaska NativeAlaskan AthabascanAlbanianAleutAlsatianAmericanApacheArabArapahoArgentineanArmenianAssyrian/Chaldean/SyriacAustralianAustrianBahamianBangladeshiBarbadianBasqueBelgianBelizeanBermudanBhutaneseBlackfeetBolivianBrazilianBritishBritish West IndianBulgarianBurmeseCajunCambodianCanadianCape VerdeanCarpatho RusynCelticCentral AmericanCentral American IndianCherokeeCheyenneChickasawChileanChineseChippewaChoctawColombianColvilleComancheCosta RicanCreeCreekCroatianCrowCubanCypriotCzechCzechoslovakianDanishDelawareDominicanDutchDutch West IndianEastern EuropeanEcuadorianEgyptianEnglishEstonianEthiopianEuropeanFijianFilipinoFinnishFrenchFrench American IndianFrench CanadianGermanGerman RussianGhanaianGreekGuamanian/ChamorroGuatemalanGuyaneseHaitianHmongHonduranHopiHoumaHungarianIcelanderIndian (Asian)IndonesianInupiatIranianIraqiIrishIroquoisIsraeliItalianJamaicanJapaneseJordanianKenyanKiowaKoreanLaotianLatvianLebaneseLiberianLithuanianLumbeeLuxembourgerMacedonianMalaysianMalteseMarshalleseMenomineeMexicanMexican American IndianMongolianMoroccanNative HawaiianNavajoNepaleseNew ZealanderNicaraguanNigerianNorthern EuropeanNorwegianOkinawanOsageOttawaPaiutePakistaniPalestinianPanamanianParaguayanPennsylvania GermanPeruvianPimaPolishPortuguesePotawatomiPuebloPuerto RicanPuget Sound SalishRomanianRussianSalvadoranSamoanScandinavianScotch-IrishScottishSeminoleSenegaleseSerbianShoshoneSierra LeoneanSiouxSlavicSlovakSloveneSomaliSouth AfricanSouth AmericanSouth American IndianSoviet UnionSpaniardSpanishSpanish AmericanSpanish American IndianSri LankanSubsaharan AfricanSudaneseSwedishSwissSyrianTaiwaneseThaiTlingit-HaidaTohono O'OdhamTonganTrinidadian and TobagonianTsimshianTurkishU.S. Virgin IslanderUgandanUkrainianUruguayanUteVenezuelanVietnameseWelshWest IndianYakamaYaquiYugoslavianYumanYup'ikZimbabwean
Immigration
NonimmigrantsImmigrantsAfghanistanAfricaAlbaniaArgentinaArmeniaAsiaAustraliaAustriaBahamasBangladeshBarbadosBelarusBelgiumBelizeBoliviaBosnia and HerzegovinaBrazilBulgariaBurma/MyanmarCabo VerdeCambodiaCameroonCanadaCaribbeanCentral AmericaChileChinaColombiaCongoCosta RicaCroatiaCubaCzechoslovakiaDenmarkDominicaDominican RepublicEastern AfricaEastern AsiaEastern EuropeEcuadorEgyptEl SalvadorEnglandEritreaEthiopiaEuropeFijiFranceGermanyGhanaGreeceGrenadaGuatemalaGuyanaHaitiHondurasHong KongHungaryIndonesiaIranIraqIrelandIsraelItalyJamaicaJapanJordanKazakhstanKenyaKoreaKuwaitLaosLatin AmericaLatviaLebanonLiberiaLithuaniaMalaysiaMexicoMicronesiaMiddle AfricaMoldovaMoroccoNepalNetherlandsNicaraguaNigeriaNorth AmericaNorth MacedoniaNorthern AfricaNorthern EuropeNorwayOceaniaPakistanPanamaPeruPhilippinesPolandPortugalRomaniaRussiaSaudi ArabiaScotlandSenegalSerbiaSierra LeoneSingaporeSomaliaSouth AfricaSouth AmericaSouth Central AsiaSouth Eastern AsiaSouthern EuropeSpainSri LankaSt. Vincent and the GrenadinesSudanSwedenSwitzerlandSyriaTaiwanThailandTrinidad and TobagoTurkeyUgandaUkraineUruguayUzbekistanVenezuelaVietnamWest IndiesWestern AfricaWestern AsiaWestern EuropeYemenZaireZimbabweAzores
Immigrants from India
Race
Ancestry
AfghanAfricanAlaska NativeAlaskan AthabascanAlbanianAleutAlsatianAmericanApacheArabArapahoArgentineanArmenianAssyrian/Chaldean/SyriacAustralianAustrianBahamianBangladeshiBarbadianBasqueBelgianBelizeanBermudanBhutaneseBlackfeetBolivianBrazilianBritishBritish West IndianBulgarianBurmeseCajunCambodianCanadianCape VerdeanCarpatho RusynCelticCentral AmericanCentral American IndianCherokeeCheyenneChickasawChileanChineseChippewaChoctawColombianColvilleComancheCosta RicanCreeCreekCroatianCrowCubanCypriotCzechCzechoslovakianDanishDelawareDominicanDutchDutch West IndianEastern EuropeanEcuadorianEgyptianEnglishEstonianEthiopianEuropeanFijianFilipinoFinnishFrenchFrench American IndianFrench CanadianGermanGerman RussianGhanaianGreekGuamanian/ChamorroGuatemalanGuyaneseHaitianHmongHonduranHopiHoumaHungarianIcelanderIndian (Asian)IndonesianInupiatIranianIraqiIrishIroquoisIsraeliItalianJamaicanJapaneseJordanianKenyanKiowaKoreanLaotianLatvianLebaneseLiberianLithuanianLumbeeLuxembourgerMacedonianMalaysianMalteseMarshalleseMenomineeMexicanMexican American IndianMongolianMoroccanNative HawaiianNavajoNepaleseNew ZealanderNicaraguanNigerianNorthern EuropeanNorwegianOkinawanOsageOttawaPaiutePakistaniPalestinianPanamanianParaguayanPennsylvania GermanPeruvianPimaPolishPortuguesePotawatomiPuebloPuerto RicanPuget Sound SalishRomanianRussianSalvadoranSamoanScandinavianScotch-IrishScottishSeminoleSenegaleseSerbianShoshoneSierra LeoneanSiouxSlavicSlovakSloveneSomaliSouth AfricanSouth AmericanSouth American IndianSoviet UnionSpaniardSpanishSpanish AmericanSpanish American IndianSri LankanSubsaharan AfricanSudaneseSwedishSwissSyrianTaiwaneseThaiTlingit-HaidaTonganTrinidadian and TobagonianTsimshianTurkishU.S. Virgin IslanderUgandanUkrainianUruguayanUteVenezuelanVietnameseWelshWest IndianYakamaYaquiYugoslavianYumanYup'ikZimbabwean
Immigration
NonimmigrantsImmigrantsAfghanistanAfricaAlbaniaArgentinaArmeniaAsiaAustraliaAustriaBahamasBangladeshBarbadosBelarusBelgiumBelizeBoliviaBosnia and HerzegovinaBrazilBulgariaBurma/MyanmarCabo VerdeCambodiaCameroonCanadaCaribbeanCentral AmericaChileChinaColombiaCongoCosta RicaCroatiaCubaCzechoslovakiaDenmarkDominicaDominican RepublicEastern AfricaEastern AsiaEastern EuropeEcuadorEgyptEl SalvadorEnglandEritreaEthiopiaEuropeFijiFranceGermanyGhanaGreeceGrenadaGuatemalaGuyanaHaitiHondurasHong KongHungaryIndiaIndonesiaIranIraqIrelandIsraelItalyJamaicaJapanJordanKazakhstanKenyaKoreaKuwaitLaosLatin AmericaLatviaLebanonLiberiaLithuaniaMalaysiaMexicoMicronesiaMiddle AfricaMoldovaMoroccoNepalNetherlandsNicaraguaNigeriaNorth AmericaNorth MacedoniaNorthern AfricaNorthern EuropeNorwayOceaniaPakistanPanamaPeruPhilippinesPolandPortugalRomaniaRussiaSaudi ArabiaScotlandSenegalSerbiaSierra LeoneSingaporeSomaliaSouth AfricaSouth AmericaSouth Central AsiaSouth Eastern AsiaSouthern EuropeSpainSri LankaSt. Vincent and the GrenadinesSudanSwedenSwitzerlandSyriaTaiwanThailandTrinidad and TobagoTurkeyUgandaUkraineUruguayUzbekistanVenezuelaVietnamWest IndiesWestern AfricaWestern AsiaWestern EuropeYemenZaireZimbabweAzores
7th Grade
Income
Poverty
Unemployment
Labor Participation
Family Structure
Vehicle Availability
Education Level
Disability

7th Grade Comparison

Tohono O'odham

Immigrants from India

Tragic
Exceptional
95.0%
7TH GRADE
0.1/ 100
METRIC RATING
281st/ 347
METRIC RANK
96.9%
7TH GRADE
99.6/ 100
METRIC RATING
68th/ 347
METRIC RANK

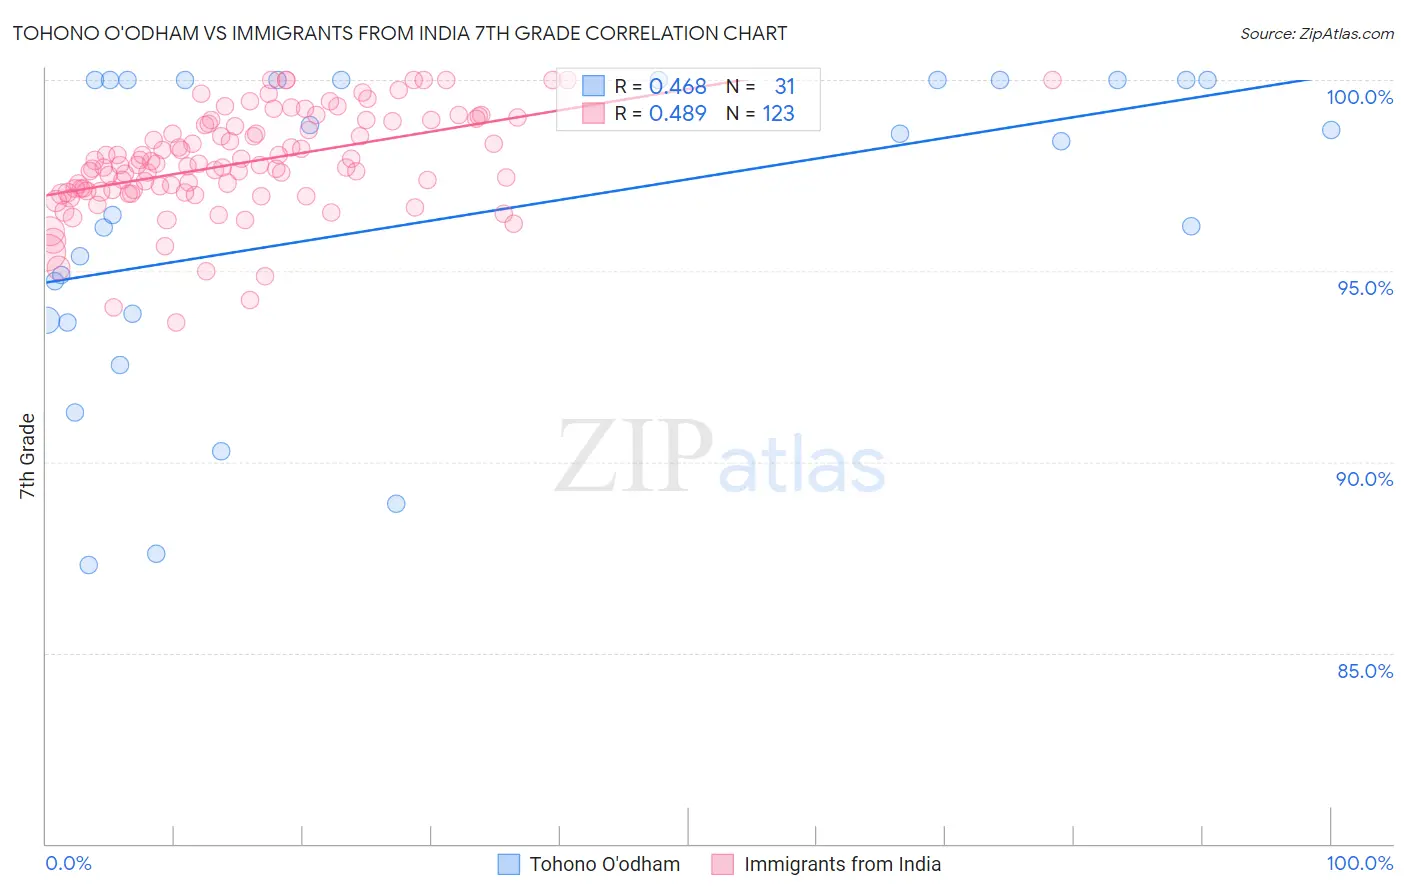
Tohono O'odham vs Immigrants from India 7th Grade Correlation Chart

The statistical analysis conducted on geographies consisting of 58,730,615 people shows a moderate positive correlation between the proportion of Tohono O'odham and percentage of population with at least 7th grade education in the United States with a correlation coefficient (R) of 0.468 and weighted average of 95.0%. Similarly, the statistical analysis conducted on geographies consisting of 434,105,844 people shows a moderate positive correlation between the proportion of Immigrants from India and percentage of population with at least 7th grade education in the United States with a correlation coefficient (R) of 0.489 and weighted average of 96.9%, a difference of 1.9%.
Tohono O'odham vs Immigrants from India 7th Grade

7th Grade Correlation Summary

MeasurementTohono O'odhamImmigrants from India
Minimum87.3%93.7%
Maximum100.0%100.0%
Range12.7%6.3%
Mean96.4%97.8%
Median98.4%97.8%
Interquartile 25% (IQ1)93.7%97.1%
Interquartile 75% (IQ3)100.0%98.9%
Interquartile Range (IQR)6.3%1.9%
Standard Deviation (Sample)4.1%1.3%
Standard Deviation (Population)4.0%1.3%

Similar Demographics by 7th Grade

Demographics Similar to Tohono O'odham by 7th Grade

In terms of 7th grade, the demographic groups most similar to Tohono O'odham are Immigrants from St. Vincent and the Grenadines (95.0%, a difference of 0.0%), Immigrants from Bolivia (95.0%, a difference of 0.010%), Barbadian (95.1%, a difference of 0.030%), Immigrants from Trinidad and Tobago (95.1%, a difference of 0.040%), and Immigrants from Afghanistan (95.1%, a difference of 0.070%).
DemographicsRating | Rank7th Grade
Immigrants | Western Africa
0.2
/100
|
#274
Tragic
95.1%
Immigrants | Colombia
0.2
/100
|
#275
Tragic
95.1%
Immigrants | Thailand
0.2
/100
|
#276
Tragic
95.1%
Immigrants | Afghanistan
0.2
/100
|
#277
Tragic
95.1%
Immigrants | Trinidad and Tobago
0.1
/100
|
#278
Tragic
95.1%
Barbadians
0.1
/100
|
#279
Tragic
95.1%
Immigrants | St. Vincent and the Grenadines
0.1
/100
|
#280
Tragic
95.0%
Tohono O'odham
0.1
/100
|
#281
Tragic
95.0%
Immigrants | Bolivia
0.1
/100
|
#282
Tragic
95.0%
Immigrants | Barbados
0.1
/100
|
#283
Tragic
95.0%
Armenians
0.1
/100
|
#284
Tragic
95.0%
Immigrants | Eritrea
0.1
/100
|
#285
Tragic
94.9%
Immigrants | Philippines
0.0
/100
|
#286
Tragic
94.9%
Immigrants | Peru
0.0
/100
|
#287
Tragic
94.9%
British West Indians
0.0
/100
|
#288
Tragic
94.8%

Demographics Similar to Immigrants from India by 7th Grade

In terms of 7th grade, the demographic groups most similar to Immigrants from India are Ukrainian (96.9%, a difference of 0.020%), Native Hawaiian (96.9%, a difference of 0.020%), Iranian (96.8%, a difference of 0.020%), New Zealander (96.8%, a difference of 0.030%), and Immigrants from Lithuania (96.8%, a difference of 0.030%).
DemographicsRating | Rank7th Grade
Creek
99.8
/100
|
#61
Exceptional
96.9%
Immigrants | North America
99.8
/100
|
#62
Exceptional
96.9%
Immigrants | Northern Europe
99.7
/100
|
#63
Exceptional
96.9%
Immigrants | Austria
99.7
/100
|
#64
Exceptional
96.9%
Canadians
99.7
/100
|
#65
Exceptional
96.9%
Ukrainians
99.7
/100
|
#66
Exceptional
96.9%
Native Hawaiians
99.7
/100
|
#67
Exceptional
96.9%
Immigrants | India
99.6
/100
|
#68
Exceptional
96.9%
Iranians
99.6
/100
|
#69
Exceptional
96.8%
New Zealanders
99.6
/100
|
#70
Exceptional
96.8%
Immigrants | Lithuania
99.6
/100
|
#71
Exceptional
96.8%
Cajuns
99.5
/100
|
#72
Exceptional
96.8%
Arapaho
99.5
/100
|
#73
Exceptional
96.8%
Immigrants | England
99.5
/100
|
#74
Exceptional
96.8%
Zimbabweans
99.5
/100
|
#75
Exceptional
96.8%