Cuban vs Czechoslovakian 7th Grade
COMPARE
Cuban
Czechoslovakian
7th Grade
7th Grade Comparison
Cubans
Czechoslovakians
94.6%
7TH GRADE
0.0/ 100
METRIC RATING
296th/ 347
METRIC RANK
97.1%
7TH GRADE
99.9/ 100
METRIC RATING
45th/ 347
METRIC RANK
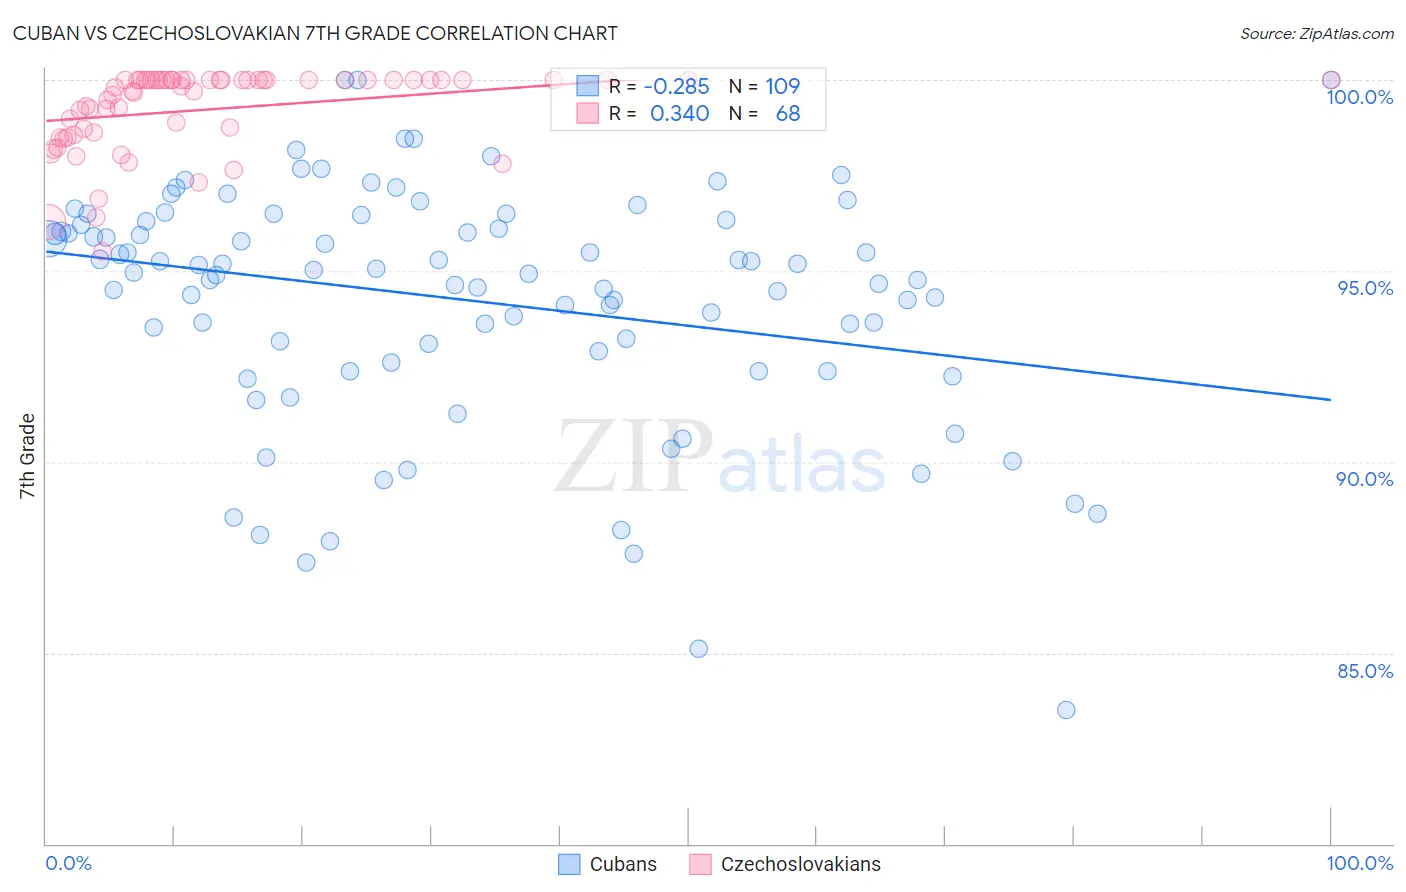
Cuban vs Czechoslovakian 7th Grade Correlation Chart
The statistical analysis conducted on geographies consisting of 449,368,946 people shows a weak negative correlation between the proportion of Cubans and percentage of population with at least 7th grade education in the United States with a correlation coefficient (R) of -0.285 and weighted average of 94.6%. Similarly, the statistical analysis conducted on geographies consisting of 368,666,801 people shows a mild positive correlation between the proportion of Czechoslovakians and percentage of population with at least 7th grade education in the United States with a correlation coefficient (R) of 0.340 and weighted average of 97.1%, a difference of 2.6%.
7th Grade Correlation Summary
| Measurement | Cuban | Czechoslovakian |
| Minimum | 83.5% | 95.5% |
| Maximum | 100.0% | 100.0% |
| Range | 16.5% | 4.5% |
| Mean | 94.2% | 99.2% |
| Median | 94.9% | 99.9% |
| Interquartile 25% (IQ1) | 92.7% | 98.6% |
| Interquartile 75% (IQ3) | 96.3% | 100.0% |
| Interquartile Range (IQR) | 3.6% | 1.4% |
| Standard Deviation (Sample) | 3.1% | 1.1% |
| Standard Deviation (Population) | 3.1% | 1.1% |
Similar Demographics by 7th Grade
Demographics Similar to Cubans by 7th Grade
In terms of 7th grade, the demographic groups most similar to Cubans are Yaqui (94.6%, a difference of 0.010%), Haitian (94.7%, a difference of 0.040%), Immigrants from South Eastern Asia (94.5%, a difference of 0.10%), Indonesian (94.5%, a difference of 0.11%), and Bangladeshi (94.5%, a difference of 0.11%).
| Demographics | Rating | Rank | 7th Grade |
| Taiwanese | 0.0 /100 | #289 | Tragic 94.8% |
| Malaysians | 0.0 /100 | #290 | Tragic 94.8% |
| Immigrants | Grenada | 0.0 /100 | #291 | Tragic 94.8% |
| Immigrants | West Indies | 0.0 /100 | #292 | Tragic 94.8% |
| Fijians | 0.0 /100 | #293 | Tragic 94.7% |
| Haitians | 0.0 /100 | #294 | Tragic 94.7% |
| Yaqui | 0.0 /100 | #295 | Tragic 94.6% |
| Cubans | 0.0 /100 | #296 | Tragic 94.6% |
| Immigrants | South Eastern Asia | 0.0 /100 | #297 | Tragic 94.5% |
| Indonesians | 0.0 /100 | #298 | Tragic 94.5% |
| Bangladeshis | 0.0 /100 | #299 | Tragic 94.5% |
| Immigrants | Burma/Myanmar | 0.0 /100 | #300 | Tragic 94.5% |
| Immigrants | Dominica | 0.0 /100 | #301 | Tragic 94.5% |
| Immigrants | Laos | 0.0 /100 | #302 | Tragic 94.5% |
| Sri Lankans | 0.0 /100 | #303 | Tragic 94.4% |
Demographics Similar to Czechoslovakians by 7th Grade
In terms of 7th grade, the demographic groups most similar to Czechoslovakians are Aleut (97.1%, a difference of 0.0%), Maltese (97.1%, a difference of 0.010%), Northern European (97.1%, a difference of 0.010%), Bulgarian (97.1%, a difference of 0.030%), and Celtic (97.1%, a difference of 0.030%).
| Demographics | Rating | Rank | 7th Grade |
| Belgians | 100.0 /100 | #38 | Exceptional 97.2% |
| Latvians | 100.0 /100 | #39 | Exceptional 97.2% |
| Luxembourgers | 100.0 /100 | #40 | Exceptional 97.2% |
| Eastern Europeans | 100.0 /100 | #41 | Exceptional 97.2% |
| Chinese | 99.9 /100 | #42 | Exceptional 97.1% |
| Maltese | 99.9 /100 | #43 | Exceptional 97.1% |
| Northern Europeans | 99.9 /100 | #44 | Exceptional 97.1% |
| Czechoslovakians | 99.9 /100 | #45 | Exceptional 97.1% |
| Aleuts | 99.9 /100 | #46 | Exceptional 97.1% |
| Bulgarians | 99.9 /100 | #47 | Exceptional 97.1% |
| Celtics | 99.9 /100 | #48 | Exceptional 97.1% |
| Slavs | 99.9 /100 | #49 | Exceptional 97.1% |
| Immigrants | Scotland | 99.9 /100 | #50 | Exceptional 97.1% |
| Estonians | 99.9 /100 | #51 | Exceptional 97.0% |
| Greeks | 99.9 /100 | #52 | Exceptional 97.0% |