Cuban vs Cambodian 7th Grade
COMPARE
Cuban
Cambodian
7th Grade
7th Grade Comparison
Cubans
Cambodians
94.6%
7TH GRADE
0.0/ 100
METRIC RATING
296th/ 347
METRIC RANK
96.3%
7TH GRADE
88.3/ 100
METRIC RATING
140th/ 347
METRIC RANK
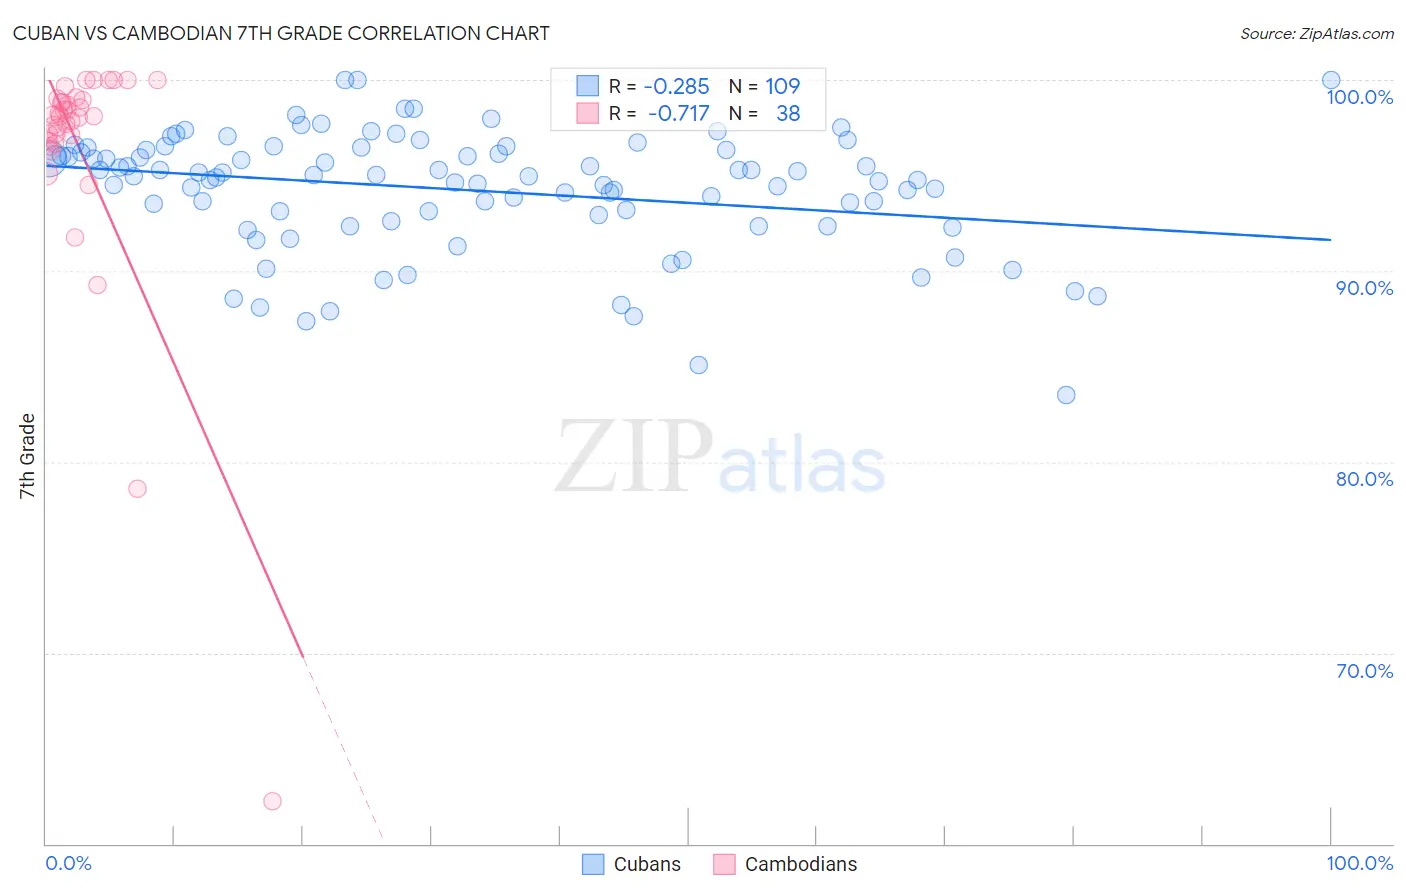
Cuban vs Cambodian 7th Grade Correlation Chart
The statistical analysis conducted on geographies consisting of 449,368,946 people shows a weak negative correlation between the proportion of Cubans and percentage of population with at least 7th grade education in the United States with a correlation coefficient (R) of -0.285 and weighted average of 94.6%. Similarly, the statistical analysis conducted on geographies consisting of 102,514,976 people shows a strong negative correlation between the proportion of Cambodians and percentage of population with at least 7th grade education in the United States with a correlation coefficient (R) of -0.717 and weighted average of 96.3%, a difference of 1.8%.
7th Grade Correlation Summary
| Measurement | Cuban | Cambodian |
| Minimum | 83.5% | 62.2% |
| Maximum | 100.0% | 100.0% |
| Range | 16.5% | 37.8% |
| Mean | 94.2% | 96.3% |
| Median | 94.9% | 98.1% |
| Interquartile 25% (IQ1) | 92.7% | 96.8% |
| Interquartile 75% (IQ3) | 96.3% | 99.0% |
| Interquartile Range (IQR) | 3.6% | 2.2% |
| Standard Deviation (Sample) | 3.1% | 6.8% |
| Standard Deviation (Population) | 3.1% | 6.7% |
Similar Demographics by 7th Grade
Demographics Similar to Cubans by 7th Grade
In terms of 7th grade, the demographic groups most similar to Cubans are Yaqui (94.6%, a difference of 0.010%), Haitian (94.7%, a difference of 0.040%), Immigrants from South Eastern Asia (94.5%, a difference of 0.10%), Indonesian (94.5%, a difference of 0.11%), and Bangladeshi (94.5%, a difference of 0.11%).
| Demographics | Rating | Rank | 7th Grade |
| Taiwanese | 0.0 /100 | #289 | Tragic 94.8% |
| Malaysians | 0.0 /100 | #290 | Tragic 94.8% |
| Immigrants | Grenada | 0.0 /100 | #291 | Tragic 94.8% |
| Immigrants | West Indies | 0.0 /100 | #292 | Tragic 94.8% |
| Fijians | 0.0 /100 | #293 | Tragic 94.7% |
| Haitians | 0.0 /100 | #294 | Tragic 94.7% |
| Yaqui | 0.0 /100 | #295 | Tragic 94.6% |
| Cubans | 0.0 /100 | #296 | Tragic 94.6% |
| Immigrants | South Eastern Asia | 0.0 /100 | #297 | Tragic 94.5% |
| Indonesians | 0.0 /100 | #298 | Tragic 94.5% |
| Bangladeshis | 0.0 /100 | #299 | Tragic 94.5% |
| Immigrants | Burma/Myanmar | 0.0 /100 | #300 | Tragic 94.5% |
| Immigrants | Dominica | 0.0 /100 | #301 | Tragic 94.5% |
| Immigrants | Laos | 0.0 /100 | #302 | Tragic 94.5% |
| Sri Lankans | 0.0 /100 | #303 | Tragic 94.4% |
Demographics Similar to Cambodians by 7th Grade
In terms of 7th grade, the demographic groups most similar to Cambodians are Basque (96.4%, a difference of 0.020%), Immigrants from South Central Asia (96.3%, a difference of 0.020%), Burmese (96.3%, a difference of 0.020%), Spanish (96.3%, a difference of 0.020%), and Immigrants from Turkey (96.4%, a difference of 0.030%).
| Demographics | Rating | Rank | 7th Grade |
| Hmong | 91.5 /100 | #133 | Exceptional 96.4% |
| Soviet Union | 91.2 /100 | #134 | Exceptional 96.4% |
| Immigrants | Kuwait | 91.1 /100 | #135 | Exceptional 96.4% |
| Immigrants | Hungary | 90.6 /100 | #136 | Exceptional 96.4% |
| Immigrants | Turkey | 90.2 /100 | #137 | Exceptional 96.4% |
| Jordanians | 90.0 /100 | #138 | Excellent 96.4% |
| Basques | 89.3 /100 | #139 | Excellent 96.4% |
| Cambodians | 88.3 /100 | #140 | Excellent 96.3% |
| Immigrants | South Central Asia | 87.1 /100 | #141 | Excellent 96.3% |
| Burmese | 87.1 /100 | #142 | Excellent 96.3% |
| Spanish | 86.6 /100 | #143 | Excellent 96.3% |
| Immigrants | Greece | 85.9 /100 | #144 | Excellent 96.3% |
| Blackfeet | 83.9 /100 | #145 | Excellent 96.3% |
| Immigrants | Eastern Europe | 83.7 /100 | #146 | Excellent 96.3% |
| French American Indians | 83.1 /100 | #147 | Excellent 96.3% |