Immigrants from Latvia vs Asian 6th Grade
COMPARE
Immigrants from Latvia
Asian
6th Grade
6th Grade Comparison
Immigrants from Latvia
Asians
97.4%
6TH GRADE
96.7/ 100
METRIC RATING
112th/ 347
METRIC RANK
96.6%
6TH GRADE
2.4/ 100
METRIC RATING
235th/ 347
METRIC RANK
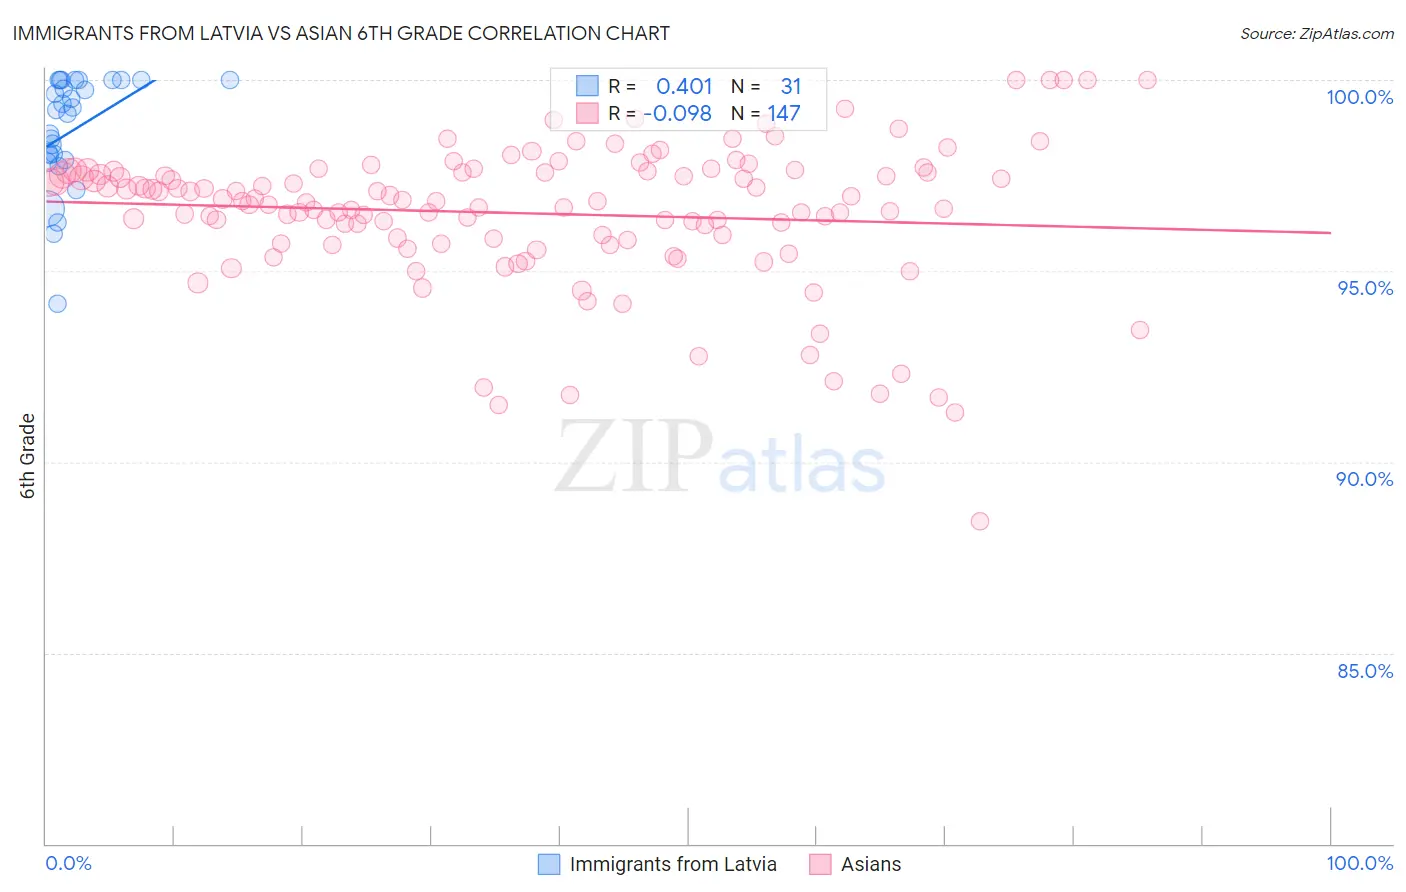
Immigrants from Latvia vs Asian 6th Grade Correlation Chart
The statistical analysis conducted on geographies consisting of 113,735,345 people shows a moderate positive correlation between the proportion of Immigrants from Latvia and percentage of population with at least 6th grade education in the United States with a correlation coefficient (R) of 0.401 and weighted average of 97.4%. Similarly, the statistical analysis conducted on geographies consisting of 550,801,467 people shows a slight negative correlation between the proportion of Asians and percentage of population with at least 6th grade education in the United States with a correlation coefficient (R) of -0.098 and weighted average of 96.6%, a difference of 0.81%.
6th Grade Correlation Summary
| Measurement | Immigrants from Latvia | Asian |
| Minimum | 94.1% | 88.5% |
| Maximum | 100.0% | 100.0% |
| Range | 5.9% | 11.5% |
| Mean | 98.7% | 96.5% |
| Median | 99.2% | 96.8% |
| Interquartile 25% (IQ1) | 97.9% | 95.8% |
| Interquartile 75% (IQ3) | 100.0% | 97.6% |
| Interquartile Range (IQR) | 2.1% | 1.8% |
| Standard Deviation (Sample) | 1.5% | 1.9% |
| Standard Deviation (Population) | 1.4% | 1.9% |
Similar Demographics by 6th Grade
Demographics Similar to Immigrants from Latvia by 6th Grade
In terms of 6th grade, the demographic groups most similar to Immigrants from Latvia are Thai (97.4%, a difference of 0.010%), Iroquois (97.4%, a difference of 0.010%), Immigrants from Saudi Arabia (97.4%, a difference of 0.010%), Colville (97.4%, a difference of 0.010%), and Nonimmigrants (97.4%, a difference of 0.020%).
| Demographics | Rating | Rank | 6th Grade |
| Cheyenne | 97.9 /100 | #105 | Exceptional 97.5% |
| Menominee | 97.7 /100 | #106 | Exceptional 97.5% |
| Immigrants | Singapore | 97.6 /100 | #107 | Exceptional 97.5% |
| Immigrants | Nonimmigrants | 97.3 /100 | #108 | Exceptional 97.4% |
| Immigrants | Czechoslovakia | 97.3 /100 | #109 | Exceptional 97.4% |
| Thais | 96.9 /100 | #110 | Exceptional 97.4% |
| Iroquois | 96.9 /100 | #111 | Exceptional 97.4% |
| Immigrants | Latvia | 96.7 /100 | #112 | Exceptional 97.4% |
| Immigrants | Saudi Arabia | 96.5 /100 | #113 | Exceptional 97.4% |
| Colville | 96.4 /100 | #114 | Exceptional 97.4% |
| Immigrants | Switzerland | 95.7 /100 | #115 | Exceptional 97.4% |
| Lebanese | 95.5 /100 | #116 | Exceptional 97.4% |
| Basques | 95.4 /100 | #117 | Exceptional 97.4% |
| Immigrants | Japan | 95.2 /100 | #118 | Exceptional 97.4% |
| Immigrants | Zimbabwe | 95.0 /100 | #119 | Exceptional 97.4% |
Demographics Similar to Asians by 6th Grade
In terms of 6th grade, the demographic groups most similar to Asians are Uruguayan (96.6%, a difference of 0.0%), Immigrants from Indonesia (96.6%, a difference of 0.010%), Immigrants from Eastern Africa (96.6%, a difference of 0.020%), Yuman (96.7%, a difference of 0.030%), and Nigerian (96.6%, a difference of 0.030%).
| Demographics | Rating | Rank | 6th Grade |
| Immigrants | Malaysia | 4.0 /100 | #228 | Tragic 96.7% |
| Assyrians/Chaldeans/Syriacs | 4.0 /100 | #229 | Tragic 96.7% |
| Immigrants | Eastern Asia | 4.0 /100 | #230 | Tragic 96.7% |
| Sub-Saharan Africans | 3.5 /100 | #231 | Tragic 96.7% |
| South American Indians | 3.5 /100 | #232 | Tragic 96.7% |
| Yuman | 3.2 /100 | #233 | Tragic 96.7% |
| Uruguayans | 2.5 /100 | #234 | Tragic 96.6% |
| Asians | 2.4 /100 | #235 | Tragic 96.6% |
| Immigrants | Indonesia | 2.3 /100 | #236 | Tragic 96.6% |
| Immigrants | Eastern Africa | 2.0 /100 | #237 | Tragic 96.6% |
| Nigerians | 1.9 /100 | #238 | Tragic 96.6% |
| Indians (Asian) | 1.9 /100 | #239 | Tragic 96.6% |
| Koreans | 1.9 /100 | #240 | Tragic 96.6% |
| Senegalese | 1.8 /100 | #241 | Tragic 96.6% |
| Immigrants | Asia | 1.8 /100 | #242 | Tragic 96.6% |