Crow vs Hawaiian Professional Degree
COMPARE
Crow
Hawaiian
Professional Degree
Professional Degree Comparison
Crow
Hawaiians
3.2%
PROFESSIONAL DEGREE
0.0/ 100
METRIC RATING
324th/ 347
METRIC RANK
3.4%
PROFESSIONAL DEGREE
0.2/ 100
METRIC RATING
296th/ 347
METRIC RANK
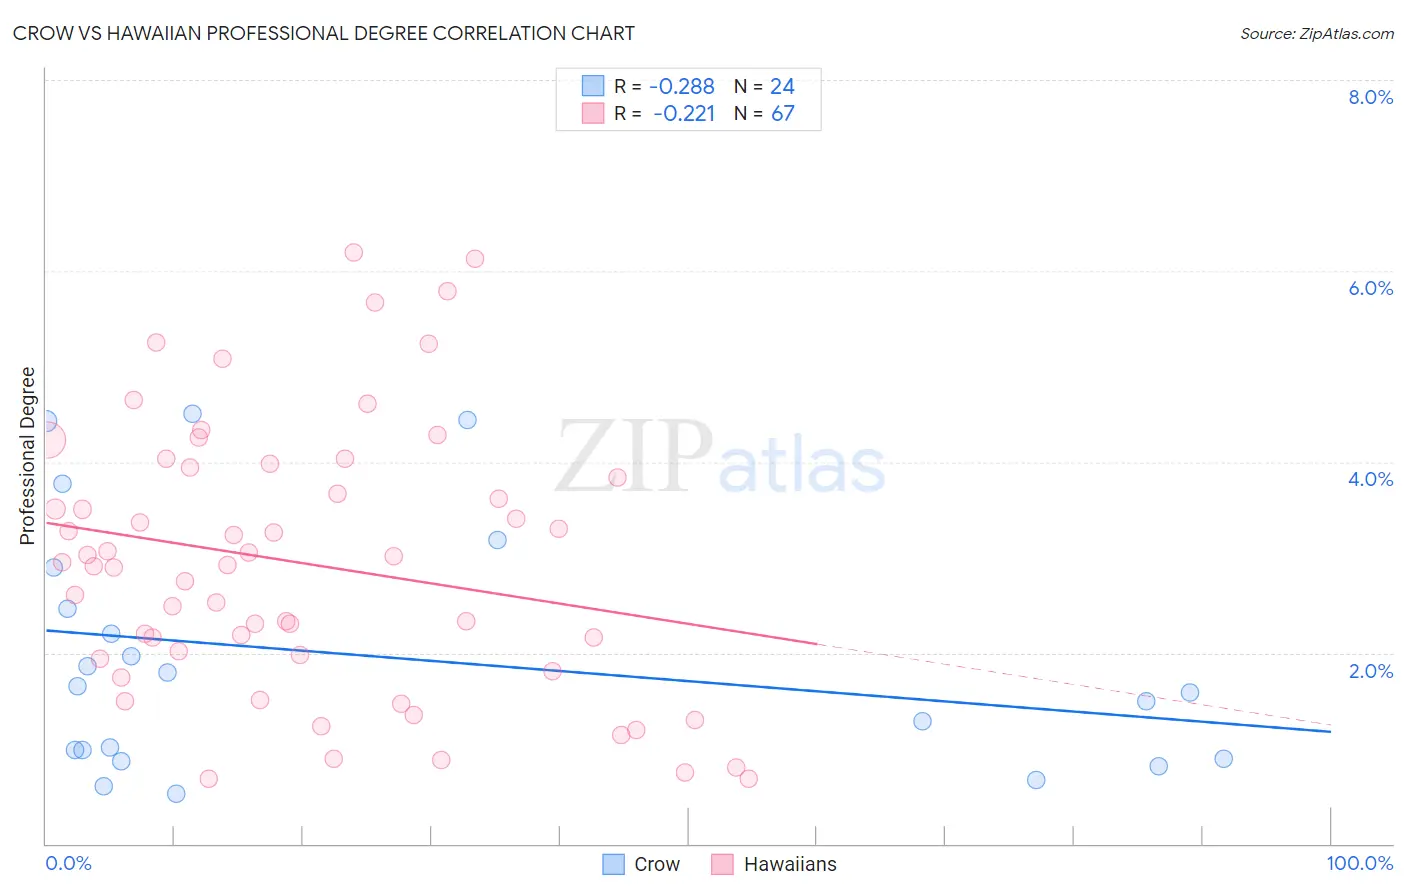
Crow vs Hawaiian Professional Degree Correlation Chart
The statistical analysis conducted on geographies consisting of 59,107,625 people shows a weak negative correlation between the proportion of Crow and percentage of population with at least professional degree education in the United States with a correlation coefficient (R) of -0.288 and weighted average of 3.2%. Similarly, the statistical analysis conducted on geographies consisting of 326,653,731 people shows a weak negative correlation between the proportion of Hawaiians and percentage of population with at least professional degree education in the United States with a correlation coefficient (R) of -0.221 and weighted average of 3.4%, a difference of 9.0%.
Professional Degree Correlation Summary
| Measurement | Crow | Hawaiian |
| Minimum | 0.53% | 0.68% |
| Maximum | 4.5% | 6.2% |
| Range | 4.0% | 5.5% |
| Mean | 2.0% | 2.9% |
| Median | 1.6% | 2.9% |
| Interquartile 25% (IQ1) | 0.93% | 1.9% |
| Interquartile 75% (IQ3) | 2.7% | 3.9% |
| Interquartile Range (IQR) | 1.7% | 2.0% |
| Standard Deviation (Sample) | 1.3% | 1.4% |
| Standard Deviation (Population) | 1.3% | 1.4% |
Similar Demographics by Professional Degree
Demographics Similar to Crow by Professional Degree
In terms of professional degree, the demographic groups most similar to Crow are Yaqui (3.2%, a difference of 0.060%), Inupiat (3.2%, a difference of 0.27%), Hispanic or Latino (3.2%, a difference of 0.35%), Tsimshian (3.2%, a difference of 0.72%), and Seminole (3.2%, a difference of 1.1%).
| Demographics | Rating | Rank | Professional Degree |
| Nepalese | 0.1 /100 | #317 | Tragic 3.2% |
| Immigrants | Micronesia | 0.1 /100 | #318 | Tragic 3.2% |
| Choctaw | 0.1 /100 | #319 | Tragic 3.2% |
| Seminole | 0.1 /100 | #320 | Tragic 3.2% |
| Tsimshian | 0.0 /100 | #321 | Tragic 3.2% |
| Hispanics or Latinos | 0.0 /100 | #322 | Tragic 3.2% |
| Inupiat | 0.0 /100 | #323 | Tragic 3.2% |
| Crow | 0.0 /100 | #324 | Tragic 3.2% |
| Yaqui | 0.0 /100 | #325 | Tragic 3.2% |
| Menominee | 0.0 /100 | #326 | Tragic 3.1% |
| Dutch West Indians | 0.0 /100 | #327 | Tragic 3.1% |
| Creek | 0.0 /100 | #328 | Tragic 3.1% |
| Bangladeshis | 0.0 /100 | #329 | Tragic 3.1% |
| Immigrants | Cabo Verde | 0.0 /100 | #330 | Tragic 3.1% |
| Kiowa | 0.0 /100 | #331 | Tragic 3.1% |
Demographics Similar to Hawaiians by Professional Degree
In terms of professional degree, the demographic groups most similar to Hawaiians are Immigrants from Guatemala (3.4%, a difference of 0.010%), Paiute (3.4%, a difference of 0.16%), Immigrants from Honduras (3.5%, a difference of 0.25%), Immigrants from Liberia (3.4%, a difference of 0.34%), and Ottawa (3.4%, a difference of 0.39%).
| Demographics | Rating | Rank | Professional Degree |
| Guatemalans | 0.3 /100 | #289 | Tragic 3.5% |
| Chippewa | 0.3 /100 | #290 | Tragic 3.5% |
| Alaska Natives | 0.3 /100 | #291 | Tragic 3.5% |
| Immigrants | Belize | 0.3 /100 | #292 | Tragic 3.5% |
| Immigrants | Honduras | 0.3 /100 | #293 | Tragic 3.5% |
| Paiute | 0.3 /100 | #294 | Tragic 3.4% |
| Immigrants | Guatemala | 0.2 /100 | #295 | Tragic 3.4% |
| Hawaiians | 0.2 /100 | #296 | Tragic 3.4% |
| Immigrants | Liberia | 0.2 /100 | #297 | Tragic 3.4% |
| Ottawa | 0.2 /100 | #298 | Tragic 3.4% |
| Immigrants | Yemen | 0.2 /100 | #299 | Tragic 3.4% |
| Blacks/African Americans | 0.2 /100 | #300 | Tragic 3.4% |
| Immigrants | Dominican Republic | 0.2 /100 | #301 | Tragic 3.4% |
| Malaysians | 0.2 /100 | #302 | Tragic 3.4% |
| Immigrants | Haiti | 0.2 /100 | #303 | Tragic 3.4% |