Immigrants from Somalia vs Welsh Professional Degree
COMPARE
Immigrants from Somalia
Welsh
Professional Degree
Professional Degree Comparison
Immigrants from Somalia
Welsh
4.1%
PROFESSIONAL DEGREE
12.5/ 100
METRIC RATING
208th/ 347
METRIC RANK
4.3%
PROFESSIONAL DEGREE
35.8/ 100
METRIC RATING
185th/ 347
METRIC RANK
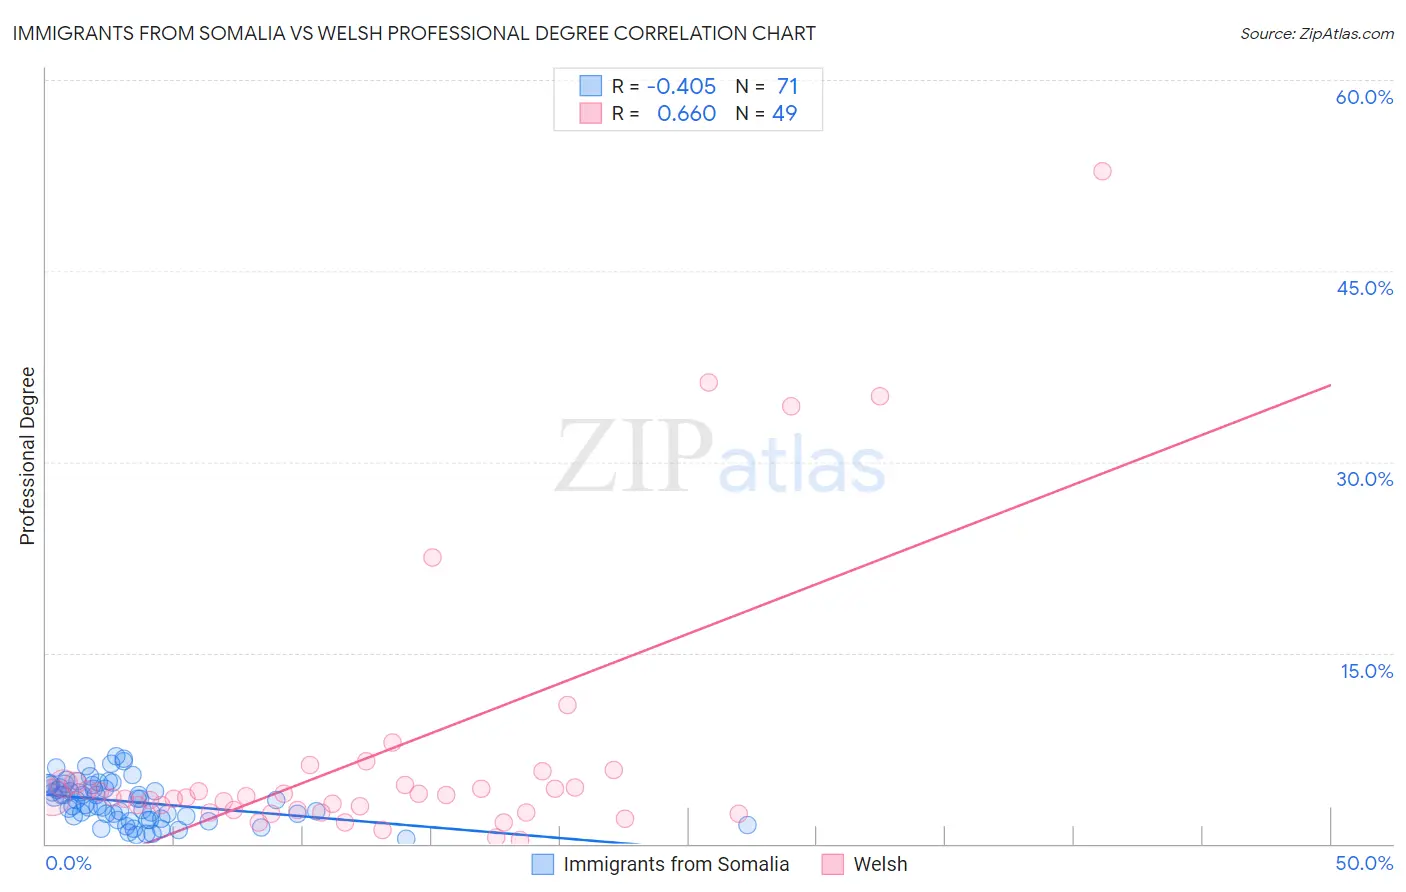
Immigrants from Somalia vs Welsh Professional Degree Correlation Chart
The statistical analysis conducted on geographies consisting of 92,074,778 people shows a moderate negative correlation between the proportion of Immigrants from Somalia and percentage of population with at least professional degree education in the United States with a correlation coefficient (R) of -0.405 and weighted average of 4.1%. Similarly, the statistical analysis conducted on geographies consisting of 523,806,417 people shows a significant positive correlation between the proportion of Welsh and percentage of population with at least professional degree education in the United States with a correlation coefficient (R) of 0.660 and weighted average of 4.3%, a difference of 5.3%.
Professional Degree Correlation Summary
| Measurement | Immigrants from Somalia | Welsh |
| Minimum | 0.40% | 0.26% |
| Maximum | 6.8% | 52.8% |
| Range | 6.4% | 52.6% |
| Mean | 3.3% | 7.0% |
| Median | 3.4% | 3.6% |
| Interquartile 25% (IQ1) | 2.0% | 2.5% |
| Interquartile 75% (IQ3) | 4.6% | 4.8% |
| Interquartile Range (IQR) | 2.6% | 2.2% |
| Standard Deviation (Sample) | 1.6% | 10.6% |
| Standard Deviation (Population) | 1.6% | 10.5% |
Similar Demographics by Professional Degree
Demographics Similar to Immigrants from Somalia by Professional Degree
In terms of professional degree, the demographic groups most similar to Immigrants from Somalia are Subsaharan African (4.1%, a difference of 0.080%), Immigrants from Panama (4.1%, a difference of 0.080%), Immigrants from Nigeria (4.1%, a difference of 0.30%), Yugoslavian (4.1%, a difference of 0.32%), and German (4.1%, a difference of 0.33%).
| Demographics | Rating | Rank | Professional Degree |
| Finns | 18.7 /100 | #201 | Poor 4.2% |
| Immigrants | Iraq | 17.1 /100 | #202 | Poor 4.2% |
| Panamanians | 15.9 /100 | #203 | Poor 4.1% |
| Barbadians | 15.8 /100 | #204 | Poor 4.1% |
| Somalis | 14.8 /100 | #205 | Poor 4.1% |
| Yugoslavians | 13.4 /100 | #206 | Poor 4.1% |
| Sub-Saharan Africans | 12.8 /100 | #207 | Poor 4.1% |
| Immigrants | Somalia | 12.5 /100 | #208 | Poor 4.1% |
| Immigrants | Panama | 12.3 /100 | #209 | Poor 4.1% |
| Immigrants | Nigeria | 11.7 /100 | #210 | Poor 4.1% |
| Germans | 11.6 /100 | #211 | Poor 4.1% |
| Whites/Caucasians | 11.2 /100 | #212 | Poor 4.1% |
| Koreans | 10.7 /100 | #213 | Poor 4.1% |
| Immigrants | Ghana | 10.6 /100 | #214 | Poor 4.1% |
| Portuguese | 10.5 /100 | #215 | Poor 4.1% |
Demographics Similar to Welsh by Professional Degree
In terms of professional degree, the demographic groups most similar to Welsh are Belgian (4.3%, a difference of 0.060%), Scotch-Irish (4.3%, a difference of 0.27%), Immigrants from Cameroon (4.3%, a difference of 0.42%), Immigrants from Thailand (4.3%, a difference of 0.69%), and Slovak (4.3%, a difference of 0.87%).
| Demographics | Rating | Rank | Professional Degree |
| Immigrants | Costa Rica | 46.7 /100 | #178 | Average 4.4% |
| Immigrants | Kenya | 45.9 /100 | #179 | Average 4.4% |
| Czechs | 44.9 /100 | #180 | Average 4.4% |
| Danes | 43.5 /100 | #181 | Average 4.4% |
| Immigrants | Immigrants | 43.2 /100 | #182 | Average 4.4% |
| Bermudans | 43.1 /100 | #183 | Average 4.4% |
| Belgians | 36.2 /100 | #184 | Fair 4.3% |
| Welsh | 35.8 /100 | #185 | Fair 4.3% |
| Scotch-Irish | 34.2 /100 | #186 | Fair 4.3% |
| Immigrants | Cameroon | 33.3 /100 | #187 | Fair 4.3% |
| Immigrants | Thailand | 31.7 /100 | #188 | Fair 4.3% |
| Slovaks | 30.7 /100 | #189 | Fair 4.3% |
| Immigrants | Poland | 29.2 /100 | #190 | Fair 4.3% |
| Sri Lankans | 29.0 /100 | #191 | Fair 4.3% |
| Ghanaians | 27.3 /100 | #192 | Fair 4.3% |