Immigrants from Japan vs Welsh Professional Degree
COMPARE
Immigrants from Japan
Welsh
Professional Degree
Professional Degree Comparison
Immigrants from Japan
Welsh
6.4%
PROFESSIONAL DEGREE
100.0/ 100
METRIC RATING
22nd/ 347
METRIC RANK
4.3%
PROFESSIONAL DEGREE
35.8/ 100
METRIC RATING
185th/ 347
METRIC RANK
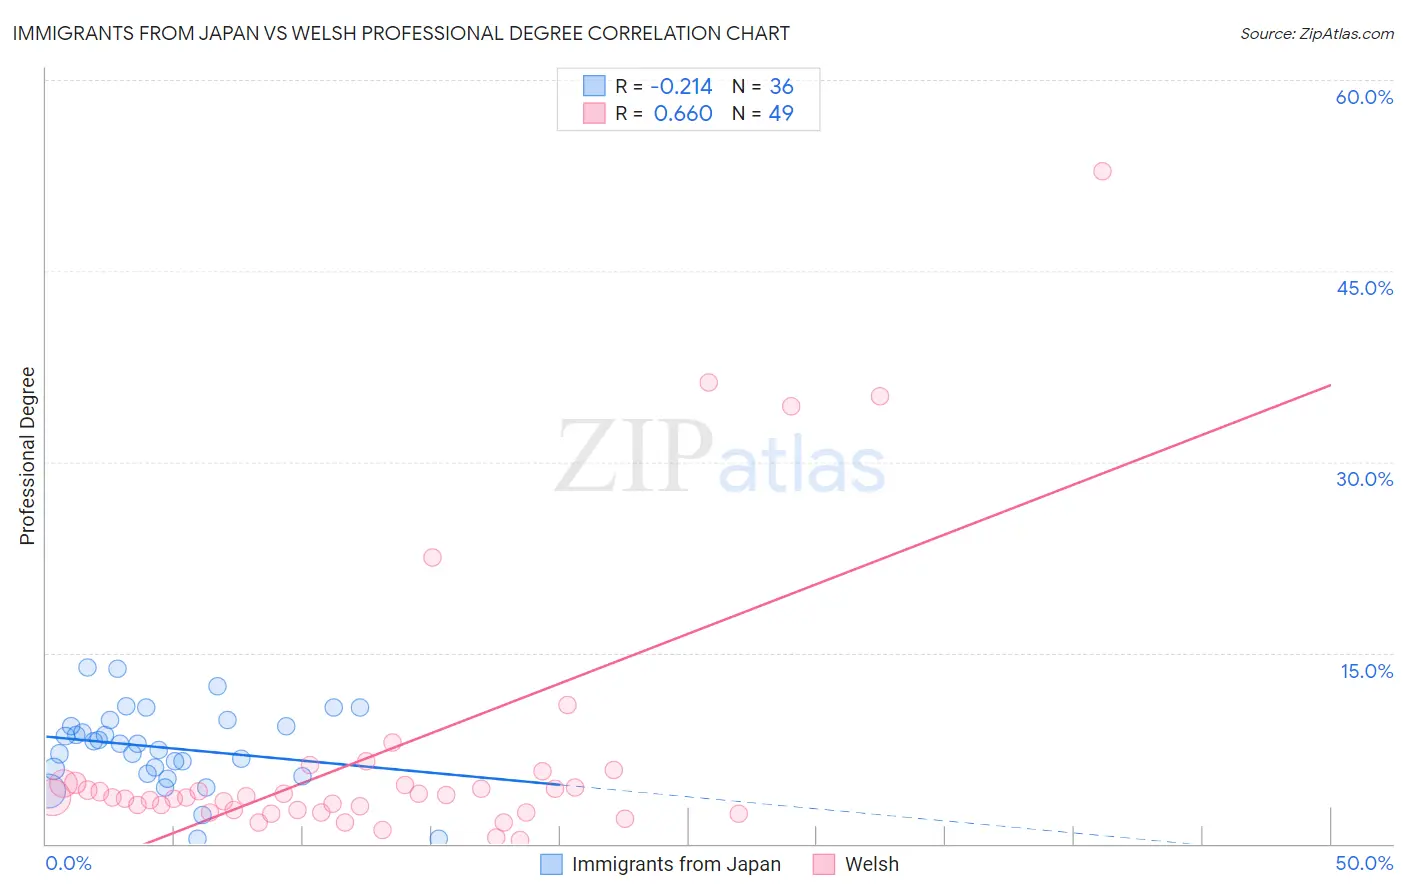
Immigrants from Japan vs Welsh Professional Degree Correlation Chart
The statistical analysis conducted on geographies consisting of 339,733,444 people shows a weak negative correlation between the proportion of Immigrants from Japan and percentage of population with at least professional degree education in the United States with a correlation coefficient (R) of -0.214 and weighted average of 6.4%. Similarly, the statistical analysis conducted on geographies consisting of 523,806,417 people shows a significant positive correlation between the proportion of Welsh and percentage of population with at least professional degree education in the United States with a correlation coefficient (R) of 0.660 and weighted average of 4.3%, a difference of 47.5%.
Professional Degree Correlation Summary
| Measurement | Immigrants from Japan | Welsh |
| Minimum | 0.36% | 0.26% |
| Maximum | 13.9% | 52.8% |
| Range | 13.5% | 52.6% |
| Mean | 7.6% | 7.0% |
| Median | 7.8% | 3.6% |
| Interquartile 25% (IQ1) | 5.7% | 2.5% |
| Interquartile 75% (IQ3) | 9.5% | 4.8% |
| Interquartile Range (IQR) | 3.8% | 2.2% |
| Standard Deviation (Sample) | 3.2% | 10.6% |
| Standard Deviation (Population) | 3.1% | 10.5% |
Similar Demographics by Professional Degree
Demographics Similar to Immigrants from Japan by Professional Degree
In terms of professional degree, the demographic groups most similar to Immigrants from Japan are Russian (6.3%, a difference of 0.48%), Immigrants from Spain (6.3%, a difference of 0.51%), Immigrants from Hong Kong (6.4%, a difference of 0.73%), Immigrants from Denmark (6.4%, a difference of 0.95%), and Immigrants from Ireland (6.3%, a difference of 1.0%).
| Demographics | Rating | Rank | Professional Degree |
| Immigrants | China | 100.0 /100 | #15 | Exceptional 6.7% |
| Immigrants | Sweden | 100.0 /100 | #16 | Exceptional 6.7% |
| Immigrants | Eastern Asia | 100.0 /100 | #17 | Exceptional 6.6% |
| Soviet Union | 100.0 /100 | #18 | Exceptional 6.6% |
| Indians (Asian) | 100.0 /100 | #19 | Exceptional 6.5% |
| Immigrants | Denmark | 100.0 /100 | #20 | Exceptional 6.4% |
| Immigrants | Hong Kong | 100.0 /100 | #21 | Exceptional 6.4% |
| Immigrants | Japan | 100.0 /100 | #22 | Exceptional 6.4% |
| Russians | 100.0 /100 | #23 | Exceptional 6.3% |
| Immigrants | Spain | 100.0 /100 | #24 | Exceptional 6.3% |
| Immigrants | Ireland | 100.0 /100 | #25 | Exceptional 6.3% |
| Latvians | 100.0 /100 | #26 | Exceptional 6.2% |
| Immigrants | Northern Europe | 100.0 /100 | #27 | Exceptional 6.2% |
| Turks | 100.0 /100 | #28 | Exceptional 6.2% |
| Immigrants | Sri Lanka | 100.0 /100 | #29 | Exceptional 6.2% |
Demographics Similar to Welsh by Professional Degree
In terms of professional degree, the demographic groups most similar to Welsh are Belgian (4.3%, a difference of 0.060%), Scotch-Irish (4.3%, a difference of 0.27%), Immigrants from Cameroon (4.3%, a difference of 0.42%), Immigrants from Thailand (4.3%, a difference of 0.69%), and Slovak (4.3%, a difference of 0.87%).
| Demographics | Rating | Rank | Professional Degree |
| Immigrants | Costa Rica | 46.7 /100 | #178 | Average 4.4% |
| Immigrants | Kenya | 45.9 /100 | #179 | Average 4.4% |
| Czechs | 44.9 /100 | #180 | Average 4.4% |
| Danes | 43.5 /100 | #181 | Average 4.4% |
| Immigrants | Immigrants | 43.2 /100 | #182 | Average 4.4% |
| Bermudans | 43.1 /100 | #183 | Average 4.4% |
| Belgians | 36.2 /100 | #184 | Fair 4.3% |
| Welsh | 35.8 /100 | #185 | Fair 4.3% |
| Scotch-Irish | 34.2 /100 | #186 | Fair 4.3% |
| Immigrants | Cameroon | 33.3 /100 | #187 | Fair 4.3% |
| Immigrants | Thailand | 31.7 /100 | #188 | Fair 4.3% |
| Slovaks | 30.7 /100 | #189 | Fair 4.3% |
| Immigrants | Poland | 29.2 /100 | #190 | Fair 4.3% |
| Sri Lankans | 29.0 /100 | #191 | Fair 4.3% |
| Ghanaians | 27.3 /100 | #192 | Fair 4.3% |