Immigrants from Trinidad and Tobago vs Indonesian 8th Grade
COMPARE
Immigrants from Trinidad and Tobago
Indonesian
8th Grade
8th Grade Comparison
Immigrants from Trinidad and Tobago
Indonesians
94.6%
8TH GRADE
0.1/ 100
METRIC RATING
279th/ 347
METRIC RANK
94.1%
8TH GRADE
0.0/ 100
METRIC RATING
298th/ 347
METRIC RANK
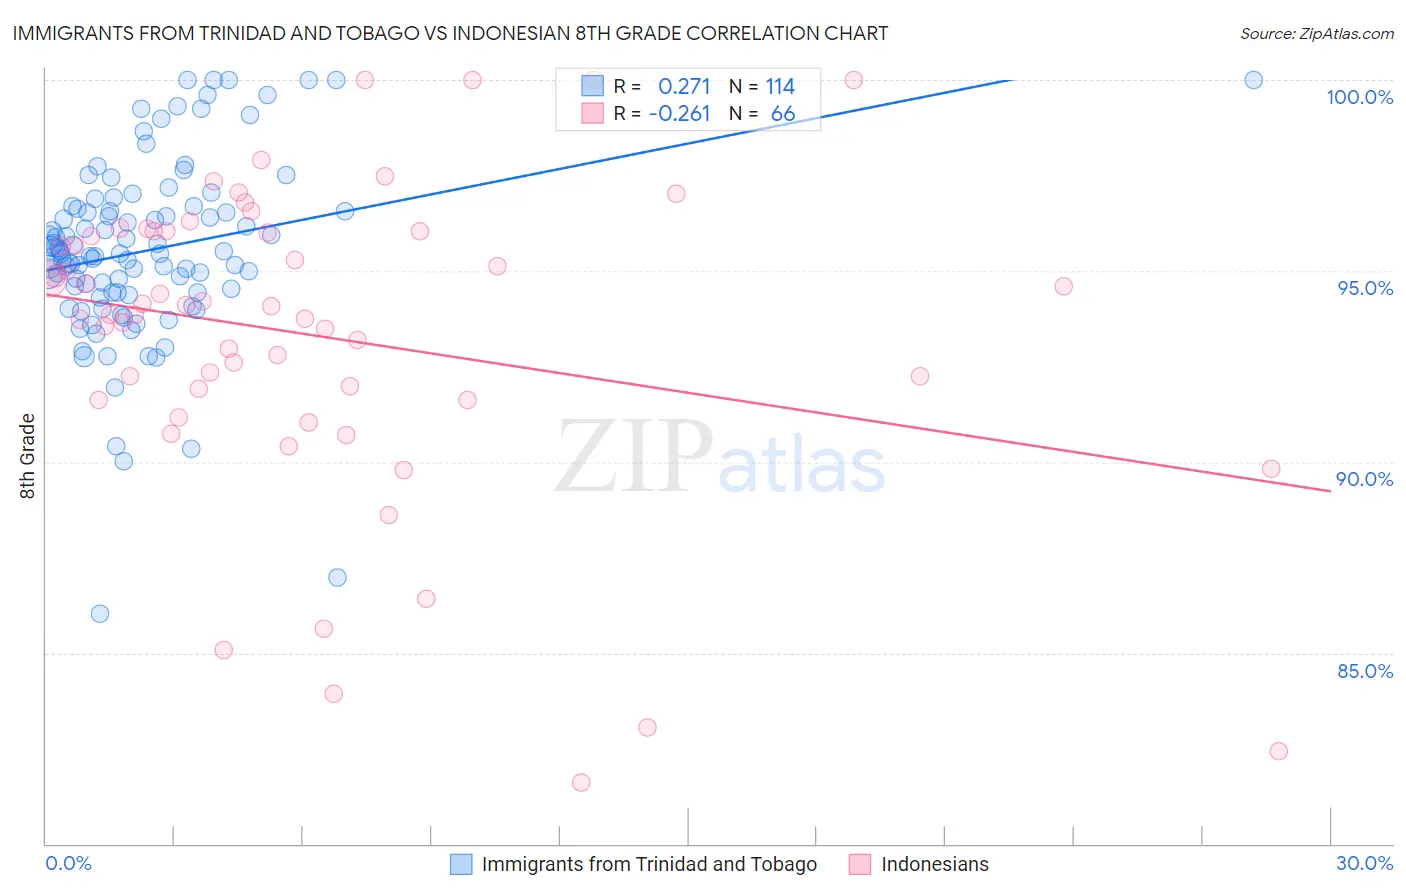
Immigrants from Trinidad and Tobago vs Indonesian 8th Grade Correlation Chart
The statistical analysis conducted on geographies consisting of 223,526,834 people shows a weak positive correlation between the proportion of Immigrants from Trinidad and Tobago and percentage of population with at least 8th grade education in the United States with a correlation coefficient (R) of 0.271 and weighted average of 94.6%. Similarly, the statistical analysis conducted on geographies consisting of 162,727,113 people shows a weak negative correlation between the proportion of Indonesians and percentage of population with at least 8th grade education in the United States with a correlation coefficient (R) of -0.261 and weighted average of 94.1%, a difference of 0.53%.
8th Grade Correlation Summary
| Measurement | Immigrants from Trinidad and Tobago | Indonesian |
| Minimum | 86.0% | 81.6% |
| Maximum | 100.0% | 100.0% |
| Range | 14.0% | 18.4% |
| Mean | 95.5% | 93.3% |
| Median | 95.5% | 94.0% |
| Interquartile 25% (IQ1) | 94.4% | 91.6% |
| Interquartile 75% (IQ3) | 96.6% | 96.0% |
| Interquartile Range (IQR) | 2.2% | 4.4% |
| Standard Deviation (Sample) | 2.4% | 4.1% |
| Standard Deviation (Population) | 2.4% | 4.1% |
Demographics Similar to Immigrants from Trinidad and Tobago and Indonesians by 8th Grade
In terms of 8th grade, the demographic groups most similar to Immigrants from Trinidad and Tobago are Barbadian (94.6%, a difference of 0.0%), Armenian (94.7%, a difference of 0.010%), Immigrants from Bolivia (94.6%, a difference of 0.010%), Immigrants from Eritrea (94.6%, a difference of 0.050%), and Immigrants from St. Vincent and the Grenadines (94.6%, a difference of 0.080%). Similarly, the demographic groups most similar to Indonesians are Immigrants from South Eastern Asia (94.2%, a difference of 0.040%), Haitian (94.2%, a difference of 0.050%), Fijian (94.2%, a difference of 0.070%), Yaqui (94.2%, a difference of 0.080%), and Houma (94.2%, a difference of 0.080%).
| Demographics | Rating | Rank | 8th Grade |
| Armenians | 0.1 /100 | #278 | Tragic 94.7% |
| Immigrants | Trinidad and Tobago | 0.1 /100 | #279 | Tragic 94.6% |
| Barbadians | 0.1 /100 | #280 | Tragic 94.6% |
| Immigrants | Bolivia | 0.1 /100 | #281 | Tragic 94.6% |
| Immigrants | Eritrea | 0.1 /100 | #282 | Tragic 94.6% |
| Immigrants | St. Vincent and the Grenadines | 0.1 /100 | #283 | Tragic 94.6% |
| Immigrants | Philippines | 0.1 /100 | #284 | Tragic 94.6% |
| Immigrants | Barbados | 0.0 /100 | #285 | Tragic 94.5% |
| Immigrants | Peru | 0.0 /100 | #286 | Tragic 94.5% |
| Tohono O'odham | 0.0 /100 | #287 | Tragic 94.5% |
| Malaysians | 0.0 /100 | #288 | Tragic 94.5% |
| British West Indians | 0.0 /100 | #289 | Tragic 94.4% |
| Immigrants | West Indies | 0.0 /100 | #290 | Tragic 94.3% |
| Immigrants | Grenada | 0.0 /100 | #291 | Tragic 94.3% |
| Bangladeshis | 0.0 /100 | #292 | Tragic 94.3% |
| Yaqui | 0.0 /100 | #293 | Tragic 94.2% |
| Houma | 0.0 /100 | #294 | Tragic 94.2% |
| Fijians | 0.0 /100 | #295 | Tragic 94.2% |
| Haitians | 0.0 /100 | #296 | Tragic 94.2% |
| Immigrants | South Eastern Asia | 0.0 /100 | #297 | Tragic 94.2% |
| Indonesians | 0.0 /100 | #298 | Tragic 94.1% |