Australian vs Indonesian 8th Grade
COMPARE
Australian
Indonesian
8th Grade
8th Grade Comparison
Australians
Indonesians
96.7%
8TH GRADE
99.8/ 100
METRIC RATING
56th/ 347
METRIC RANK
94.1%
8TH GRADE
0.0/ 100
METRIC RATING
298th/ 347
METRIC RANK
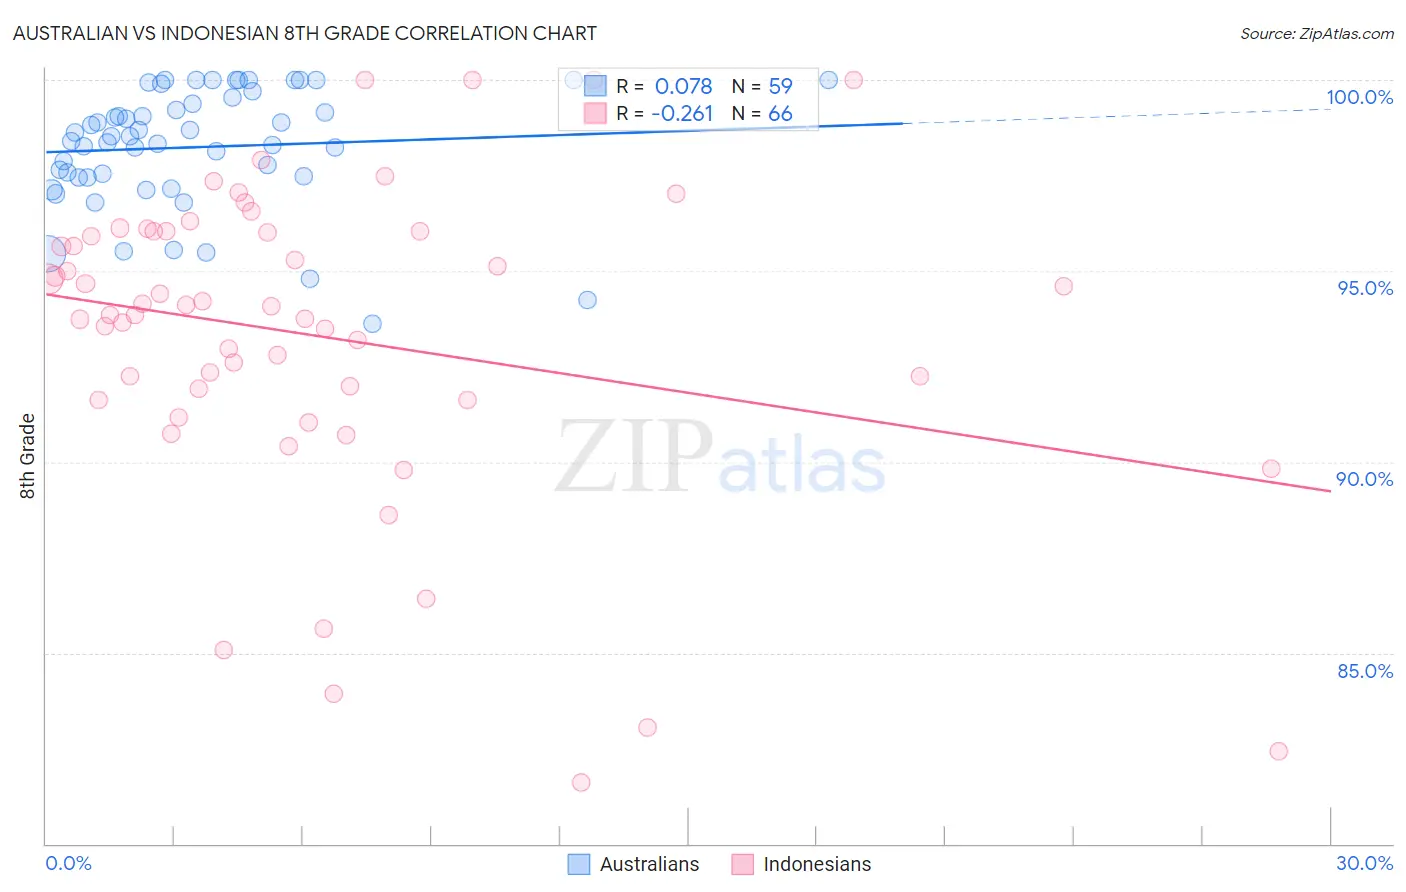
Australian vs Indonesian 8th Grade Correlation Chart
The statistical analysis conducted on geographies consisting of 224,153,693 people shows a slight positive correlation between the proportion of Australians and percentage of population with at least 8th grade education in the United States with a correlation coefficient (R) of 0.078 and weighted average of 96.7%. Similarly, the statistical analysis conducted on geographies consisting of 162,727,113 people shows a weak negative correlation between the proportion of Indonesians and percentage of population with at least 8th grade education in the United States with a correlation coefficient (R) of -0.261 and weighted average of 94.1%, a difference of 2.8%.
8th Grade Correlation Summary
| Measurement | Australian | Indonesian |
| Minimum | 93.6% | 81.6% |
| Maximum | 100.0% | 100.0% |
| Range | 6.4% | 18.4% |
| Mean | 98.2% | 93.3% |
| Median | 98.5% | 94.0% |
| Interquartile 25% (IQ1) | 97.5% | 91.6% |
| Interquartile 75% (IQ3) | 99.5% | 96.0% |
| Interquartile Range (IQR) | 2.1% | 4.4% |
| Standard Deviation (Sample) | 1.6% | 4.1% |
| Standard Deviation (Population) | 1.6% | 4.1% |
Similar Demographics by 8th Grade
Demographics Similar to Australians by 8th Grade
In terms of 8th grade, the demographic groups most similar to Australians are Serbian (96.7%, a difference of 0.0%), Russian (96.7%, a difference of 0.0%), Macedonian (96.7%, a difference of 0.0%), Austrian (96.7%, a difference of 0.010%), and Greek (96.8%, a difference of 0.030%).
| Demographics | Rating | Rank | 8th Grade |
| Estonians | 99.9 /100 | #49 | Exceptional 96.8% |
| Immigrants | Scotland | 99.9 /100 | #50 | Exceptional 96.8% |
| Celtics | 99.9 /100 | #51 | Exceptional 96.8% |
| Greeks | 99.9 /100 | #52 | Exceptional 96.8% |
| Austrians | 99.9 /100 | #53 | Exceptional 96.7% |
| Serbians | 99.8 /100 | #54 | Exceptional 96.7% |
| Russians | 99.8 /100 | #55 | Exceptional 96.7% |
| Australians | 99.8 /100 | #56 | Exceptional 96.7% |
| Macedonians | 99.8 /100 | #57 | Exceptional 96.7% |
| Immigrants | Canada | 99.8 /100 | #58 | Exceptional 96.7% |
| Immigrants | North America | 99.8 /100 | #59 | Exceptional 96.7% |
| Immigrants | Northern Europe | 99.8 /100 | #60 | Exceptional 96.7% |
| Immigrants | Austria | 99.8 /100 | #61 | Exceptional 96.7% |
| Whites/Caucasians | 99.8 /100 | #62 | Exceptional 96.7% |
| Ukrainians | 99.7 /100 | #63 | Exceptional 96.7% |
Demographics Similar to Indonesians by 8th Grade
In terms of 8th grade, the demographic groups most similar to Indonesians are Cuban (94.1%, a difference of 0.030%), Immigrants from Burma/Myanmar (94.1%, a difference of 0.030%), Immigrants from South Eastern Asia (94.2%, a difference of 0.040%), Haitian (94.2%, a difference of 0.050%), and Immigrants from Laos (94.1%, a difference of 0.050%).
| Demographics | Rating | Rank | 8th Grade |
| Immigrants | Grenada | 0.0 /100 | #291 | Tragic 94.3% |
| Bangladeshis | 0.0 /100 | #292 | Tragic 94.3% |
| Yaqui | 0.0 /100 | #293 | Tragic 94.2% |
| Houma | 0.0 /100 | #294 | Tragic 94.2% |
| Fijians | 0.0 /100 | #295 | Tragic 94.2% |
| Haitians | 0.0 /100 | #296 | Tragic 94.2% |
| Immigrants | South Eastern Asia | 0.0 /100 | #297 | Tragic 94.2% |
| Indonesians | 0.0 /100 | #298 | Tragic 94.1% |
| Cubans | 0.0 /100 | #299 | Tragic 94.1% |
| Immigrants | Burma/Myanmar | 0.0 /100 | #300 | Tragic 94.1% |
| Immigrants | Laos | 0.0 /100 | #301 | Tragic 94.1% |
| Sri Lankans | 0.0 /100 | #302 | Tragic 94.0% |
| Immigrants | Dominica | 0.0 /100 | #303 | Tragic 94.0% |
| Guyanese | 0.0 /100 | #304 | Tragic 93.9% |
| Immigrants | Haiti | 0.0 /100 | #305 | Tragic 93.9% |