Immigrants from Lebanon vs Indonesian 8th Grade
COMPARE
Immigrants from Lebanon
Indonesian
8th Grade
8th Grade Comparison
Immigrants from Lebanon
Indonesians
95.4%
8TH GRADE
13.7/ 100
METRIC RATING
209th/ 347
METRIC RANK
94.1%
8TH GRADE
0.0/ 100
METRIC RATING
298th/ 347
METRIC RANK
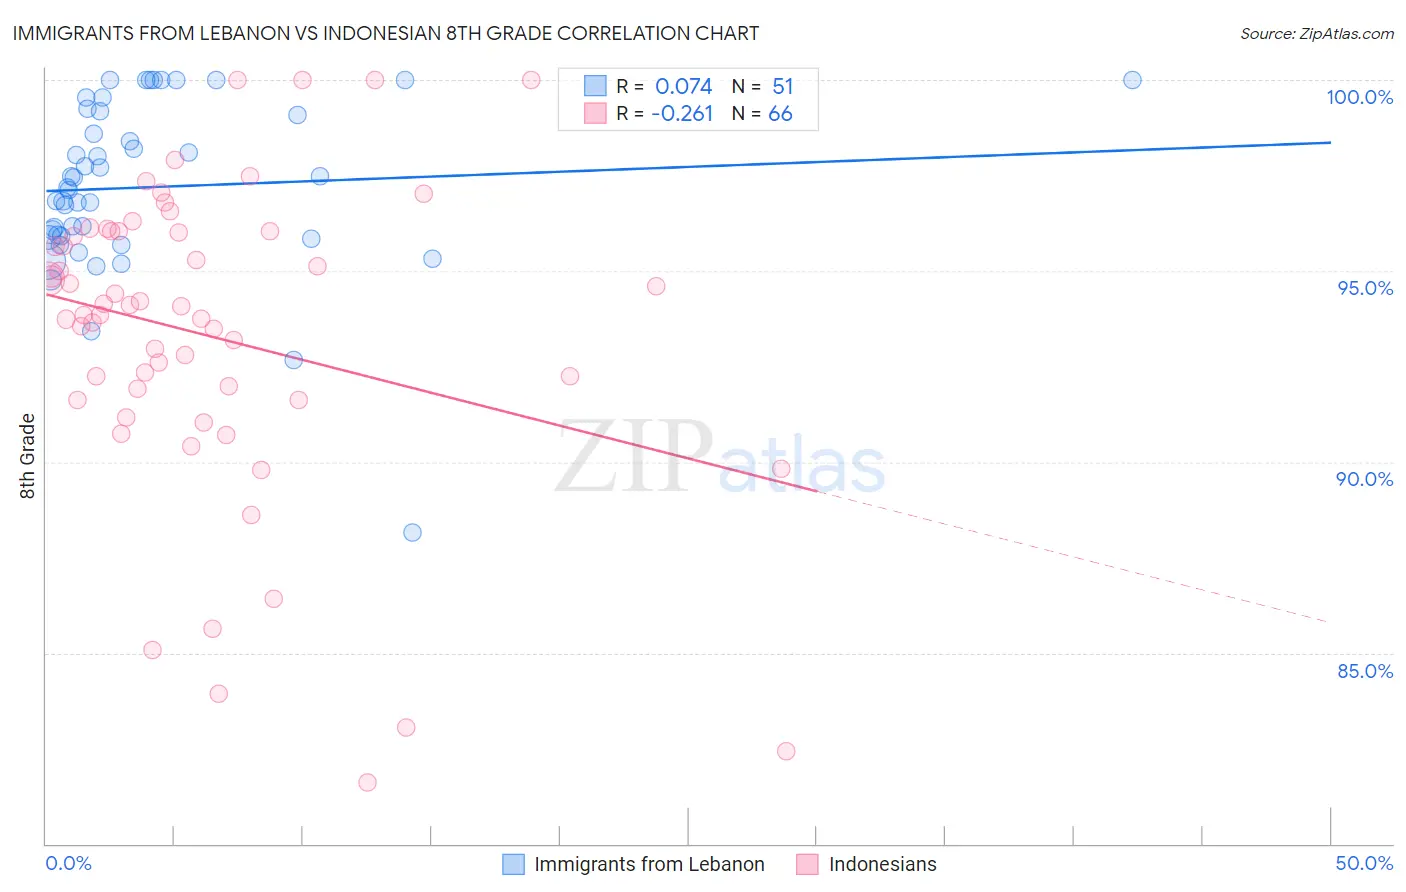
Immigrants from Lebanon vs Indonesian 8th Grade Correlation Chart
The statistical analysis conducted on geographies consisting of 217,083,357 people shows a slight positive correlation between the proportion of Immigrants from Lebanon and percentage of population with at least 8th grade education in the United States with a correlation coefficient (R) of 0.074 and weighted average of 95.4%. Similarly, the statistical analysis conducted on geographies consisting of 162,727,113 people shows a weak negative correlation between the proportion of Indonesians and percentage of population with at least 8th grade education in the United States with a correlation coefficient (R) of -0.261 and weighted average of 94.1%, a difference of 1.4%.
8th Grade Correlation Summary
| Measurement | Immigrants from Lebanon | Indonesian |
| Minimum | 88.2% | 81.6% |
| Maximum | 100.0% | 100.0% |
| Range | 11.8% | 18.4% |
| Mean | 97.2% | 93.3% |
| Median | 97.2% | 94.0% |
| Interquartile 25% (IQ1) | 95.9% | 91.6% |
| Interquartile 75% (IQ3) | 99.2% | 96.0% |
| Interquartile Range (IQR) | 3.3% | 4.4% |
| Standard Deviation (Sample) | 2.3% | 4.1% |
| Standard Deviation (Population) | 2.3% | 4.1% |
Similar Demographics by 8th Grade
Demographics Similar to Immigrants from Lebanon by 8th Grade
In terms of 8th grade, the demographic groups most similar to Immigrants from Lebanon are African (95.4%, a difference of 0.0%), Portuguese (95.5%, a difference of 0.010%), Immigrants from Sudan (95.5%, a difference of 0.020%), Immigrants from Morocco (95.4%, a difference of 0.020%), and Comanche (95.5%, a difference of 0.030%).
| Demographics | Rating | Rank | 8th Grade |
| Apache | 19.4 /100 | #202 | Poor 95.5% |
| Moroccans | 17.4 /100 | #203 | Poor 95.5% |
| Hawaiians | 16.7 /100 | #204 | Poor 95.5% |
| Immigrants | Bahamas | 16.7 /100 | #205 | Poor 95.5% |
| Comanche | 16.3 /100 | #206 | Poor 95.5% |
| Immigrants | Sudan | 15.1 /100 | #207 | Poor 95.5% |
| Portuguese | 14.3 /100 | #208 | Poor 95.5% |
| Immigrants | Lebanon | 13.7 /100 | #209 | Poor 95.4% |
| Africans | 13.6 /100 | #210 | Poor 95.4% |
| Immigrants | Morocco | 12.4 /100 | #211 | Poor 95.4% |
| Immigrants | Pakistan | 9.7 /100 | #212 | Tragic 95.4% |
| Laotians | 9.0 /100 | #213 | Tragic 95.4% |
| Immigrants | Chile | 9.0 /100 | #214 | Tragic 95.4% |
| Immigrants | Liberia | 8.9 /100 | #215 | Tragic 95.4% |
| Samoans | 8.4 /100 | #216 | Tragic 95.4% |
Demographics Similar to Indonesians by 8th Grade
In terms of 8th grade, the demographic groups most similar to Indonesians are Cuban (94.1%, a difference of 0.030%), Immigrants from Burma/Myanmar (94.1%, a difference of 0.030%), Immigrants from South Eastern Asia (94.2%, a difference of 0.040%), Haitian (94.2%, a difference of 0.050%), and Immigrants from Laos (94.1%, a difference of 0.050%).
| Demographics | Rating | Rank | 8th Grade |
| Immigrants | Grenada | 0.0 /100 | #291 | Tragic 94.3% |
| Bangladeshis | 0.0 /100 | #292 | Tragic 94.3% |
| Yaqui | 0.0 /100 | #293 | Tragic 94.2% |
| Houma | 0.0 /100 | #294 | Tragic 94.2% |
| Fijians | 0.0 /100 | #295 | Tragic 94.2% |
| Haitians | 0.0 /100 | #296 | Tragic 94.2% |
| Immigrants | South Eastern Asia | 0.0 /100 | #297 | Tragic 94.2% |
| Indonesians | 0.0 /100 | #298 | Tragic 94.1% |
| Cubans | 0.0 /100 | #299 | Tragic 94.1% |
| Immigrants | Burma/Myanmar | 0.0 /100 | #300 | Tragic 94.1% |
| Immigrants | Laos | 0.0 /100 | #301 | Tragic 94.1% |
| Sri Lankans | 0.0 /100 | #302 | Tragic 94.0% |
| Immigrants | Dominica | 0.0 /100 | #303 | Tragic 94.0% |
| Guyanese | 0.0 /100 | #304 | Tragic 93.9% |
| Immigrants | Haiti | 0.0 /100 | #305 | Tragic 93.9% |