Croatian vs Sioux No Schooling Completed
COMPARE
Croatian
Sioux
No Schooling Completed
No Schooling Completed Comparison
Croatians
Sioux
1.5%
NO SCHOOLING COMPLETED
100.0/ 100
METRIC RATING
17th/ 347
METRIC RANK
1.8%
NO SCHOOLING COMPLETED
99.0/ 100
METRIC RATING
90th/ 347
METRIC RANK
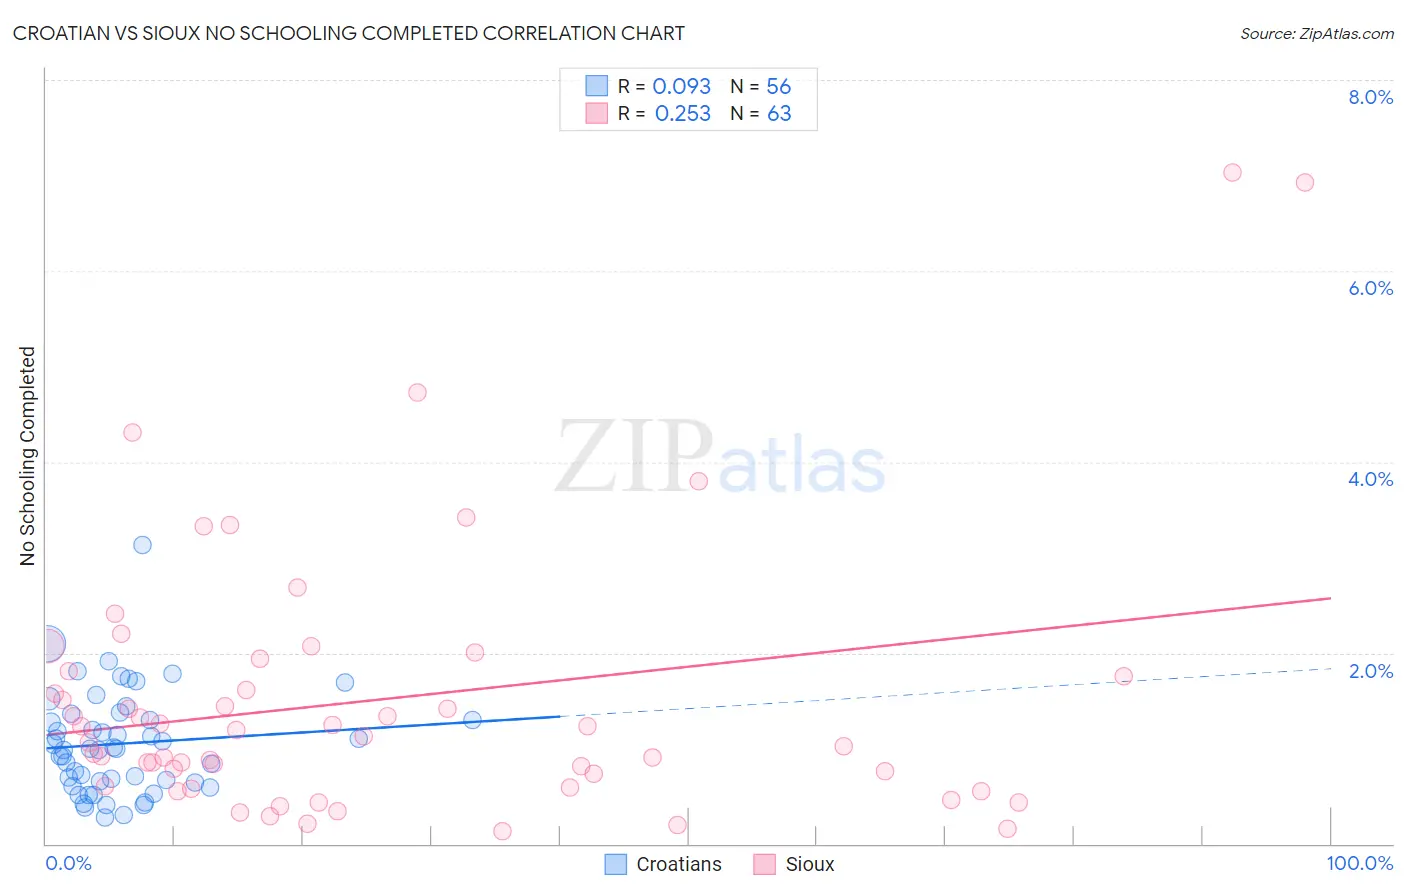
Croatian vs Sioux No Schooling Completed Correlation Chart
The statistical analysis conducted on geographies consisting of 370,650,548 people shows a slight positive correlation between the proportion of Croatians and percentage of population with no schooling in the United States with a correlation coefficient (R) of 0.093 and weighted average of 1.5%. Similarly, the statistical analysis conducted on geographies consisting of 231,835,063 people shows a weak positive correlation between the proportion of Sioux and percentage of population with no schooling in the United States with a correlation coefficient (R) of 0.253 and weighted average of 1.8%, a difference of 21.2%.
No Schooling Completed Correlation Summary
| Measurement | Croatian | Sioux |
| Minimum | 0.27% | 0.14% |
| Maximum | 3.1% | 7.0% |
| Range | 2.9% | 6.9% |
| Mean | 1.0% | 1.5% |
| Median | 1.0% | 1.1% |
| Interquartile 25% (IQ1) | 0.65% | 0.60% |
| Interquartile 75% (IQ3) | 1.3% | 1.8% |
| Interquartile Range (IQR) | 0.68% | 1.2% |
| Standard Deviation (Sample) | 0.54% | 1.4% |
| Standard Deviation (Population) | 0.54% | 1.4% |
Similar Demographics by No Schooling Completed
Demographics Similar to Croatians by No Schooling Completed
In terms of no schooling completed, the demographic groups most similar to Croatians are Finnish (1.5%, a difference of 0.010%), Danish (1.5%, a difference of 0.30%), Alaskan Athabascan (1.5%, a difference of 0.41%), Tlingit-Haida (1.5%, a difference of 0.53%), and Welsh (1.5%, a difference of 0.53%).
| Demographics | Rating | Rank | No Schooling Completed |
| Dutch | 100.0 /100 | #10 | Exceptional 1.4% |
| Lithuanians | 100.0 /100 | #11 | Exceptional 1.4% |
| Irish | 100.0 /100 | #12 | Exceptional 1.4% |
| Poles | 100.0 /100 | #13 | Exceptional 1.4% |
| Scotch-Irish | 100.0 /100 | #14 | Exceptional 1.5% |
| Tlingit-Haida | 100.0 /100 | #15 | Exceptional 1.5% |
| Finns | 100.0 /100 | #16 | Exceptional 1.5% |
| Croatians | 100.0 /100 | #17 | Exceptional 1.5% |
| Danes | 100.0 /100 | #18 | Exceptional 1.5% |
| Alaskan Athabascans | 100.0 /100 | #19 | Exceptional 1.5% |
| Welsh | 100.0 /100 | #20 | Exceptional 1.5% |
| Chinese | 100.0 /100 | #21 | Exceptional 1.5% |
| Alaska Natives | 100.0 /100 | #22 | Exceptional 1.5% |
| Europeans | 100.0 /100 | #23 | Exceptional 1.5% |
| Pennsylvania Germans | 100.0 /100 | #24 | Exceptional 1.5% |
Demographics Similar to Sioux by No Schooling Completed
In terms of no schooling completed, the demographic groups most similar to Sioux are Immigrants from Germany (1.8%, a difference of 0.11%), Romanian (1.8%, a difference of 0.62%), South African (1.8%, a difference of 0.72%), Immigrants from Western Europe (1.8%, a difference of 0.76%), and Osage (1.8%, a difference of 0.79%).
| Demographics | Rating | Rank | No Schooling Completed |
| Potawatomi | 99.3 /100 | #83 | Exceptional 1.7% |
| Immigrants | Denmark | 99.2 /100 | #84 | Exceptional 1.7% |
| Immigrants | Australia | 99.2 /100 | #85 | Exceptional 1.7% |
| Ukrainians | 99.2 /100 | #86 | Exceptional 1.8% |
| Osage | 99.2 /100 | #87 | Exceptional 1.8% |
| Immigrants | Western Europe | 99.2 /100 | #88 | Exceptional 1.8% |
| South Africans | 99.1 /100 | #89 | Exceptional 1.8% |
| Sioux | 99.0 /100 | #90 | Exceptional 1.8% |
| Immigrants | Germany | 99.0 /100 | #91 | Exceptional 1.8% |
| Romanians | 98.8 /100 | #92 | Exceptional 1.8% |
| Turks | 98.7 /100 | #93 | Exceptional 1.8% |
| Immigrants | Nonimmigrants | 98.5 /100 | #94 | Exceptional 1.8% |
| Puget Sound Salish | 98.5 /100 | #95 | Exceptional 1.8% |
| Bhutanese | 98.4 /100 | #96 | Exceptional 1.8% |
| Immigrants | Ireland | 98.4 /100 | #97 | Exceptional 1.8% |