Immigrants from Nepal vs Immigrants from Albania 8th Grade
COMPARE
Immigrants from Nepal
Immigrants from Albania
8th Grade
8th Grade Comparison
Immigrants from Nepal
Immigrants from Albania
95.6%
8TH GRADE
30.2/ 100
METRIC RATING
191st/ 347
METRIC RANK
95.7%
8TH GRADE
49.6/ 100
METRIC RATING
175th/ 347
METRIC RANK
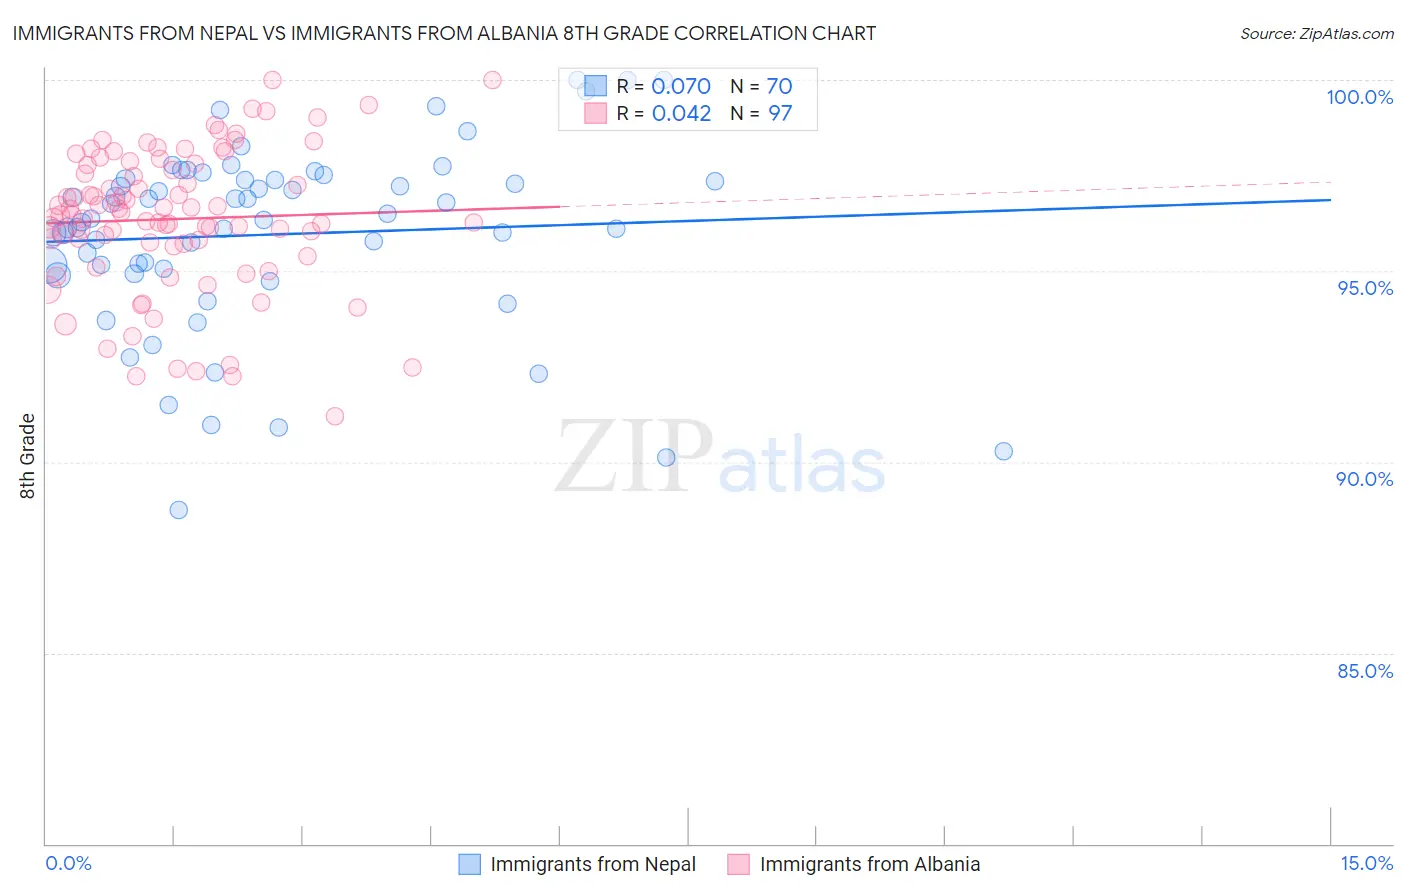
Immigrants from Nepal vs Immigrants from Albania 8th Grade Correlation Chart
The statistical analysis conducted on geographies consisting of 186,622,433 people shows a slight positive correlation between the proportion of Immigrants from Nepal and percentage of population with at least 8th grade education in the United States with a correlation coefficient (R) of 0.070 and weighted average of 95.6%. Similarly, the statistical analysis conducted on geographies consisting of 119,265,453 people shows no correlation between the proportion of Immigrants from Albania and percentage of population with at least 8th grade education in the United States with a correlation coefficient (R) of 0.042 and weighted average of 95.7%, a difference of 0.13%.
8th Grade Correlation Summary
| Measurement | Immigrants from Nepal | Immigrants from Albania |
| Minimum | 88.7% | 91.2% |
| Maximum | 100.0% | 100.0% |
| Range | 11.3% | 8.8% |
| Mean | 96.0% | 96.4% |
| Median | 96.4% | 96.5% |
| Interquartile 25% (IQ1) | 95.1% | 95.7% |
| Interquartile 75% (IQ3) | 97.4% | 97.8% |
| Interquartile Range (IQR) | 2.3% | 2.1% |
| Standard Deviation (Sample) | 2.4% | 1.9% |
| Standard Deviation (Population) | 2.4% | 1.9% |
Demographics Similar to Immigrants from Nepal and Immigrants from Albania by 8th Grade
In terms of 8th grade, the demographic groups most similar to Immigrants from Nepal are Immigrants from Venezuela (95.6%, a difference of 0.0%), Immigrants from Micronesia (95.6%, a difference of 0.010%), Pima (95.6%, a difference of 0.010%), Panamanian (95.6%, a difference of 0.010%), and Sudanese (95.6%, a difference of 0.020%). Similarly, the demographic groups most similar to Immigrants from Albania are Chilean (95.7%, a difference of 0.0%), Pakistani (95.7%, a difference of 0.010%), Marshallese (95.7%, a difference of 0.010%), Venezuelan (95.7%, a difference of 0.010%), and Mongolian (95.8%, a difference of 0.020%).
| Demographics | Rating | Rank | 8th Grade |
| Mongolians | 53.0 /100 | #173 | Average 95.8% |
| Chileans | 50.0 /100 | #174 | Average 95.7% |
| Immigrants | Albania | 49.6 /100 | #175 | Average 95.7% |
| Pakistanis | 48.8 /100 | #176 | Average 95.7% |
| Marshallese | 47.6 /100 | #177 | Average 95.7% |
| Venezuelans | 47.5 /100 | #178 | Average 95.7% |
| Immigrants | Brazil | 45.4 /100 | #179 | Average 95.7% |
| Iraqis | 40.5 /100 | #180 | Average 95.7% |
| Immigrants | Spain | 38.7 /100 | #181 | Fair 95.7% |
| Immigrants | Egypt | 37.9 /100 | #182 | Fair 95.7% |
| Immigrants | Iraq | 36.2 /100 | #183 | Fair 95.6% |
| Immigrants | Uganda | 36.0 /100 | #184 | Fair 95.6% |
| Blacks/African Americans | 34.8 /100 | #185 | Fair 95.6% |
| Brazilians | 34.8 /100 | #186 | Fair 95.6% |
| Sudanese | 33.0 /100 | #187 | Fair 95.6% |
| Liberians | 32.4 /100 | #188 | Fair 95.6% |
| Immigrants | Micronesia | 31.6 /100 | #189 | Fair 95.6% |
| Immigrants | Venezuela | 30.8 /100 | #190 | Fair 95.6% |
| Immigrants | Nepal | 30.2 /100 | #191 | Fair 95.6% |
| Pima | 28.6 /100 | #192 | Fair 95.6% |
| Panamanians | 28.4 /100 | #193 | Fair 95.6% |