Immigrants from Austria vs Immigrants from Albania 8th Grade
COMPARE
Immigrants from Austria
Immigrants from Albania
8th Grade
8th Grade Comparison
Immigrants from Austria
Immigrants from Albania
96.7%
8TH GRADE
99.8/ 100
METRIC RATING
61st/ 347
METRIC RANK
95.7%
8TH GRADE
49.6/ 100
METRIC RATING
175th/ 347
METRIC RANK
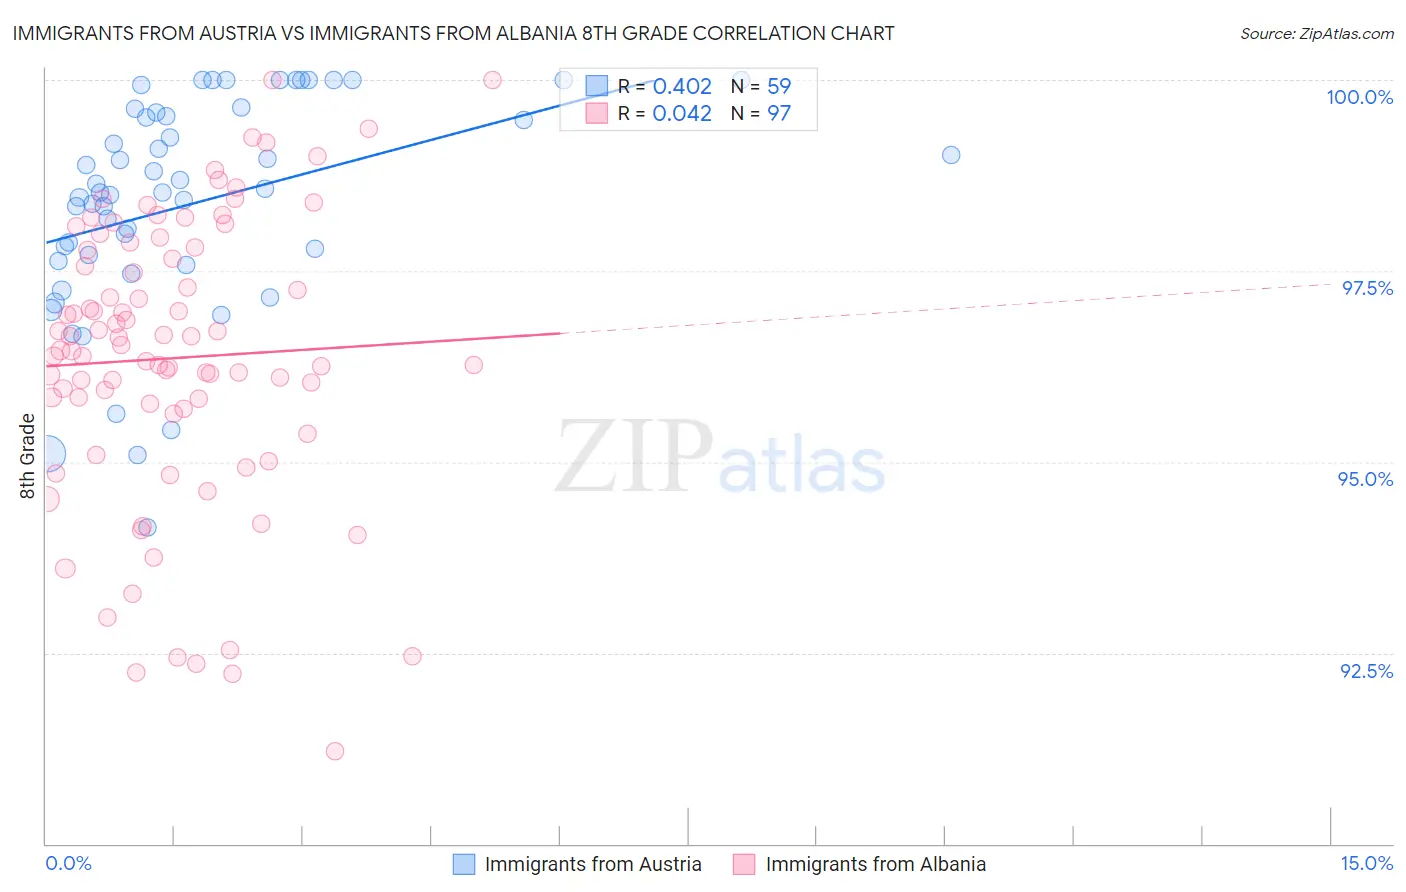
Immigrants from Austria vs Immigrants from Albania 8th Grade Correlation Chart
The statistical analysis conducted on geographies consisting of 167,973,800 people shows a moderate positive correlation between the proportion of Immigrants from Austria and percentage of population with at least 8th grade education in the United States with a correlation coefficient (R) of 0.402 and weighted average of 96.7%. Similarly, the statistical analysis conducted on geographies consisting of 119,265,453 people shows no correlation between the proportion of Immigrants from Albania and percentage of population with at least 8th grade education in the United States with a correlation coefficient (R) of 0.042 and weighted average of 95.7%, a difference of 0.99%.
8th Grade Correlation Summary
| Measurement | Immigrants from Austria | Immigrants from Albania |
| Minimum | 94.1% | 91.2% |
| Maximum | 100.0% | 100.0% |
| Range | 5.9% | 8.8% |
| Mean | 98.4% | 96.4% |
| Median | 98.5% | 96.5% |
| Interquartile 25% (IQ1) | 97.6% | 95.7% |
| Interquartile 75% (IQ3) | 99.6% | 97.8% |
| Interquartile Range (IQR) | 1.9% | 2.1% |
| Standard Deviation (Sample) | 1.4% | 1.9% |
| Standard Deviation (Population) | 1.4% | 1.9% |
Similar Demographics by 8th Grade
Demographics Similar to Immigrants from Austria by 8th Grade
In terms of 8th grade, the demographic groups most similar to Immigrants from Austria are Immigrants from Northern Europe (96.7%, a difference of 0.0%), Immigrants from North America (96.7%, a difference of 0.010%), White/Caucasian (96.7%, a difference of 0.010%), Immigrants from Canada (96.7%, a difference of 0.020%), and Ukrainian (96.7%, a difference of 0.030%).
| Demographics | Rating | Rank | 8th Grade |
| Serbians | 99.8 /100 | #54 | Exceptional 96.7% |
| Russians | 99.8 /100 | #55 | Exceptional 96.7% |
| Australians | 99.8 /100 | #56 | Exceptional 96.7% |
| Macedonians | 99.8 /100 | #57 | Exceptional 96.7% |
| Immigrants | Canada | 99.8 /100 | #58 | Exceptional 96.7% |
| Immigrants | North America | 99.8 /100 | #59 | Exceptional 96.7% |
| Immigrants | Northern Europe | 99.8 /100 | #60 | Exceptional 96.7% |
| Immigrants | Austria | 99.8 /100 | #61 | Exceptional 96.7% |
| Whites/Caucasians | 99.8 /100 | #62 | Exceptional 96.7% |
| Ukrainians | 99.7 /100 | #63 | Exceptional 96.7% |
| Immigrants | India | 99.7 /100 | #64 | Exceptional 96.6% |
| Native Hawaiians | 99.7 /100 | #65 | Exceptional 96.6% |
| Canadians | 99.7 /100 | #66 | Exceptional 96.6% |
| Iranians | 99.7 /100 | #67 | Exceptional 96.6% |
| Creek | 99.7 /100 | #68 | Exceptional 96.6% |
Demographics Similar to Immigrants from Albania by 8th Grade
In terms of 8th grade, the demographic groups most similar to Immigrants from Albania are Chilean (95.7%, a difference of 0.0%), Pakistani (95.7%, a difference of 0.010%), Marshallese (95.7%, a difference of 0.010%), Venezuelan (95.7%, a difference of 0.010%), and Mongolian (95.8%, a difference of 0.020%).
| Demographics | Rating | Rank | 8th Grade |
| Immigrants | Ukraine | 59.5 /100 | #168 | Average 95.8% |
| Immigrants | Iran | 58.6 /100 | #169 | Average 95.8% |
| Ute | 58.5 /100 | #170 | Average 95.8% |
| Egyptians | 58.2 /100 | #171 | Average 95.8% |
| Immigrants | Korea | 57.9 /100 | #172 | Average 95.8% |
| Mongolians | 53.0 /100 | #173 | Average 95.8% |
| Chileans | 50.0 /100 | #174 | Average 95.7% |
| Immigrants | Albania | 49.6 /100 | #175 | Average 95.7% |
| Pakistanis | 48.8 /100 | #176 | Average 95.7% |
| Marshallese | 47.6 /100 | #177 | Average 95.7% |
| Venezuelans | 47.5 /100 | #178 | Average 95.7% |
| Immigrants | Brazil | 45.4 /100 | #179 | Average 95.7% |
| Iraqis | 40.5 /100 | #180 | Average 95.7% |
| Immigrants | Spain | 38.7 /100 | #181 | Fair 95.7% |
| Immigrants | Egypt | 37.9 /100 | #182 | Fair 95.7% |