Immigrants from Uganda vs Marshallese High School Diploma
COMPARE
Immigrants from Uganda
Marshallese
High School Diploma
High School Diploma Comparison
Immigrants from Uganda
Marshallese
88.9%
HIGH SCHOOL DIPLOMA
32.6/ 100
METRIC RATING
189th/ 347
METRIC RANK
88.6%
HIGH SCHOOL DIPLOMA
18.7/ 100
METRIC RATING
199th/ 347
METRIC RANK
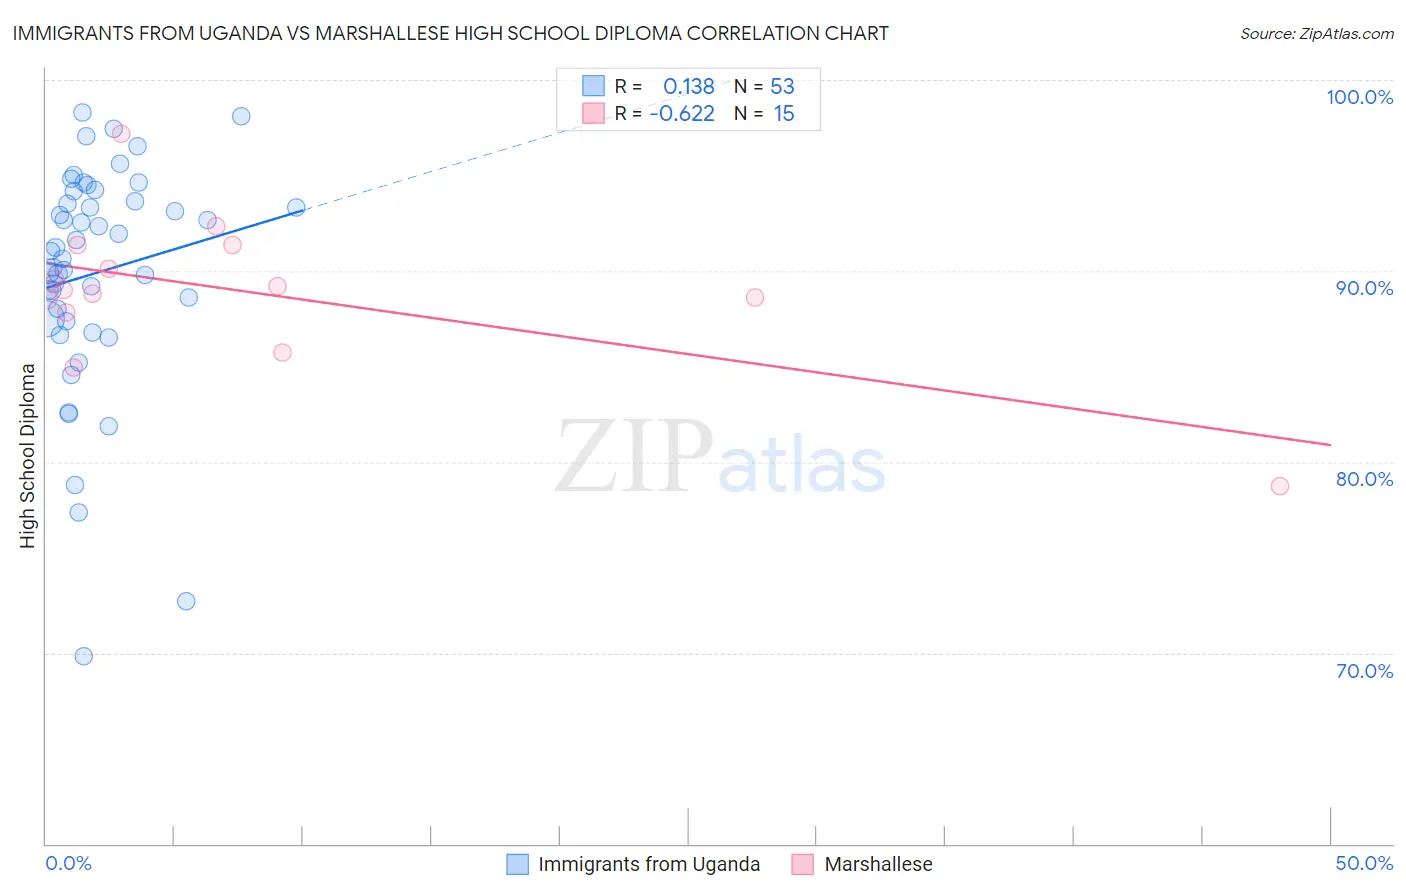
Immigrants from Uganda vs Marshallese High School Diploma Correlation Chart
The statistical analysis conducted on geographies consisting of 125,981,524 people shows a poor positive correlation between the proportion of Immigrants from Uganda and percentage of population with at least high school diploma education in the United States with a correlation coefficient (R) of 0.138 and weighted average of 88.9%. Similarly, the statistical analysis conducted on geographies consisting of 14,760,991 people shows a significant negative correlation between the proportion of Marshallese and percentage of population with at least high school diploma education in the United States with a correlation coefficient (R) of -0.622 and weighted average of 88.6%, a difference of 0.28%.
High School Diploma Correlation Summary
| Measurement | Immigrants from Uganda | Marshallese |
| Minimum | 69.8% | 78.7% |
| Maximum | 98.3% | 97.2% |
| Range | 28.5% | 18.5% |
| Mean | 89.9% | 88.9% |
| Median | 91.0% | 89.0% |
| Interquartile 25% (IQ1) | 87.4% | 87.8% |
| Interquartile 75% (IQ3) | 93.9% | 91.3% |
| Interquartile Range (IQR) | 6.5% | 3.5% |
| Standard Deviation (Sample) | 6.0% | 4.0% |
| Standard Deviation (Population) | 5.9% | 3.9% |
Demographics Similar to Immigrants from Uganda and Marshallese by High School Diploma
In terms of high school diploma, the demographic groups most similar to Immigrants from Uganda are Immigrants from Sudan (88.9%, a difference of 0.010%), Immigrants from Chile (88.9%, a difference of 0.010%), Immigrants from Ethiopia (88.9%, a difference of 0.030%), Immigrants from Eastern Africa (88.9%, a difference of 0.050%), and Guamanian/Chamorro (88.9%, a difference of 0.050%). Similarly, the demographic groups most similar to Marshallese are Liberian (88.7%, a difference of 0.0%), Hawaiian (88.6%, a difference of 0.010%), Korean (88.6%, a difference of 0.010%), Panamanian (88.6%, a difference of 0.020%), and Somali (88.6%, a difference of 0.030%).
| Demographics | Rating | Rank | High School Diploma |
| Immigrants | Syria | 39.2 /100 | #184 | Fair 89.0% |
| Ethiopians | 37.0 /100 | #185 | Fair 89.0% |
| Immigrants | Eastern Africa | 35.8 /100 | #186 | Fair 88.9% |
| Guamanians/Chamorros | 35.5 /100 | #187 | Fair 88.9% |
| Immigrants | Sudan | 33.4 /100 | #188 | Fair 88.9% |
| Immigrants | Uganda | 32.6 /100 | #189 | Fair 88.9% |
| Immigrants | Chile | 31.9 /100 | #190 | Fair 88.9% |
| Immigrants | Ethiopia | 30.9 /100 | #191 | Fair 88.9% |
| Moroccans | 29.5 /100 | #192 | Fair 88.8% |
| Immigrants | Oceania | 26.9 /100 | #193 | Fair 88.8% |
| Immigrants | Venezuela | 25.8 /100 | #194 | Fair 88.8% |
| Afghans | 23.9 /100 | #195 | Fair 88.8% |
| Immigrants | Southern Europe | 23.4 /100 | #196 | Fair 88.7% |
| French American Indians | 21.5 /100 | #197 | Fair 88.7% |
| Liberians | 18.8 /100 | #198 | Poor 88.7% |
| Marshallese | 18.7 /100 | #199 | Poor 88.6% |
| Hawaiians | 18.3 /100 | #200 | Poor 88.6% |
| Koreans | 18.1 /100 | #201 | Poor 88.6% |
| Panamanians | 18.0 /100 | #202 | Poor 88.6% |
| Somalis | 17.5 /100 | #203 | Poor 88.6% |
| Armenians | 17.2 /100 | #204 | Poor 88.6% |