Marshallese vs Immigrants from Oceania 8th Grade
COMPARE
Marshallese
Immigrants from Oceania
8th Grade
8th Grade Comparison
Marshallese
Immigrants from Oceania
95.7%
8TH GRADE
47.6/ 100
METRIC RATING
177th/ 347
METRIC RANK
95.3%
8TH GRADE
7.1/ 100
METRIC RATING
223rd/ 347
METRIC RANK
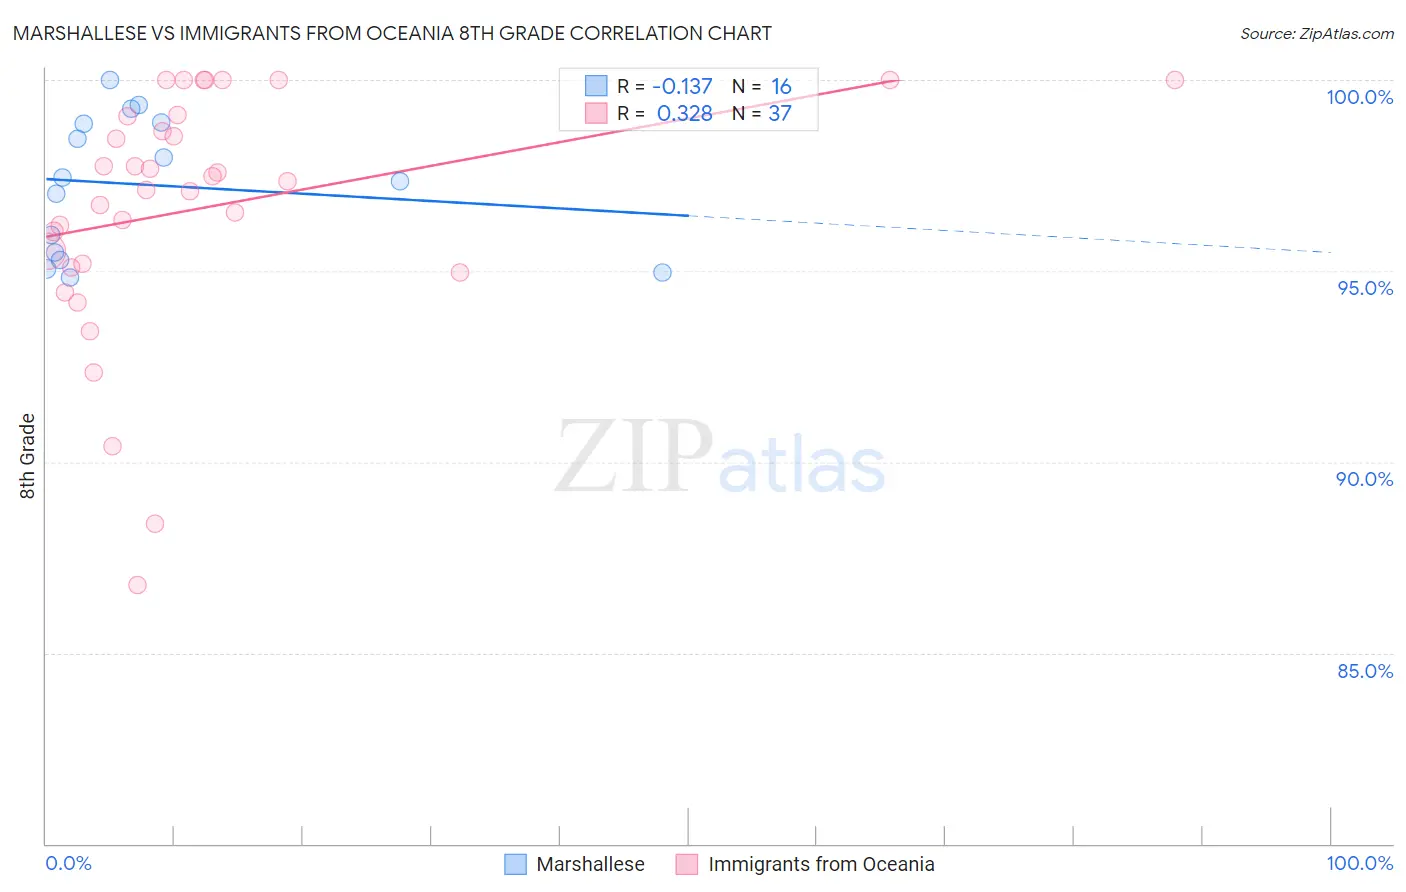
Marshallese vs Immigrants from Oceania 8th Grade Correlation Chart
The statistical analysis conducted on geographies consisting of 14,761,315 people shows a poor negative correlation between the proportion of Marshallese and percentage of population with at least 8th grade education in the United States with a correlation coefficient (R) of -0.137 and weighted average of 95.7%. Similarly, the statistical analysis conducted on geographies consisting of 305,521,521 people shows a mild positive correlation between the proportion of Immigrants from Oceania and percentage of population with at least 8th grade education in the United States with a correlation coefficient (R) of 0.328 and weighted average of 95.3%, a difference of 0.40%.
8th Grade Correlation Summary
| Measurement | Marshallese | Immigrants from Oceania |
| Minimum | 94.8% | 86.8% |
| Maximum | 100.0% | 100.0% |
| Range | 5.2% | 13.2% |
| Mean | 97.3% | 96.6% |
| Median | 97.4% | 97.3% |
| Interquartile 25% (IQ1) | 95.4% | 95.1% |
| Interquartile 75% (IQ3) | 98.9% | 99.1% |
| Interquartile Range (IQR) | 3.5% | 3.9% |
| Standard Deviation (Sample) | 1.8% | 3.2% |
| Standard Deviation (Population) | 1.7% | 3.2% |
Similar Demographics by 8th Grade
Demographics Similar to Marshallese by 8th Grade
In terms of 8th grade, the demographic groups most similar to Marshallese are Venezuelan (95.7%, a difference of 0.0%), Immigrants from Albania (95.7%, a difference of 0.010%), Pakistani (95.7%, a difference of 0.010%), Immigrants from Brazil (95.7%, a difference of 0.010%), and Chilean (95.7%, a difference of 0.020%).
| Demographics | Rating | Rank | 8th Grade |
| Ute | 58.5 /100 | #170 | Average 95.8% |
| Egyptians | 58.2 /100 | #171 | Average 95.8% |
| Immigrants | Korea | 57.9 /100 | #172 | Average 95.8% |
| Mongolians | 53.0 /100 | #173 | Average 95.8% |
| Chileans | 50.0 /100 | #174 | Average 95.7% |
| Immigrants | Albania | 49.6 /100 | #175 | Average 95.7% |
| Pakistanis | 48.8 /100 | #176 | Average 95.7% |
| Marshallese | 47.6 /100 | #177 | Average 95.7% |
| Venezuelans | 47.5 /100 | #178 | Average 95.7% |
| Immigrants | Brazil | 45.4 /100 | #179 | Average 95.7% |
| Iraqis | 40.5 /100 | #180 | Average 95.7% |
| Immigrants | Spain | 38.7 /100 | #181 | Fair 95.7% |
| Immigrants | Egypt | 37.9 /100 | #182 | Fair 95.7% |
| Immigrants | Iraq | 36.2 /100 | #183 | Fair 95.6% |
| Immigrants | Uganda | 36.0 /100 | #184 | Fair 95.6% |
Demographics Similar to Immigrants from Oceania by 8th Grade
In terms of 8th grade, the demographic groups most similar to Immigrants from Oceania are Immigrants from Malaysia (95.3%, a difference of 0.0%), Immigrants from Southern Europe (95.3%, a difference of 0.010%), Immigrants from Syria (95.3%, a difference of 0.010%), Dutch West Indian (95.4%, a difference of 0.020%), and Spanish American (95.4%, a difference of 0.020%).
| Demographics | Rating | Rank | 8th Grade |
| Samoans | 8.4 /100 | #216 | Tragic 95.4% |
| Immigrants | Eastern Asia | 8.3 /100 | #217 | Tragic 95.4% |
| Dutch West Indians | 8.1 /100 | #218 | Tragic 95.4% |
| Spanish Americans | 8.0 /100 | #219 | Tragic 95.4% |
| Immigrants | Southern Europe | 7.7 /100 | #220 | Tragic 95.3% |
| Immigrants | Syria | 7.4 /100 | #221 | Tragic 95.3% |
| Immigrants | Malaysia | 7.3 /100 | #222 | Tragic 95.3% |
| Immigrants | Oceania | 7.1 /100 | #223 | Tragic 95.3% |
| Immigrants | Western Asia | 6.0 /100 | #224 | Tragic 95.3% |
| Sub-Saharan Africans | 6.0 /100 | #225 | Tragic 95.3% |
| Navajo | 5.7 /100 | #226 | Tragic 95.3% |
| Bahamians | 5.6 /100 | #227 | Tragic 95.3% |
| Immigrants | Eastern Africa | 5.6 /100 | #228 | Tragic 95.3% |
| Immigrants | Indonesia | 4.4 /100 | #229 | Tragic 95.3% |
| Immigrants | Panama | 4.1 /100 | #230 | Tragic 95.2% |