Creek vs Immigrants from Austria GED/Equivalency
COMPARE
Creek
Immigrants from Austria
GED/Equivalency
GED/Equivalency Comparison
Creek
Immigrants from Austria
83.6%
GED/EQUIVALENCY
0.7/ 100
METRIC RATING
254th/ 347
METRIC RANK
88.3%
GED/EQUIVALENCY
99.7/ 100
METRIC RATING
37th/ 347
METRIC RANK
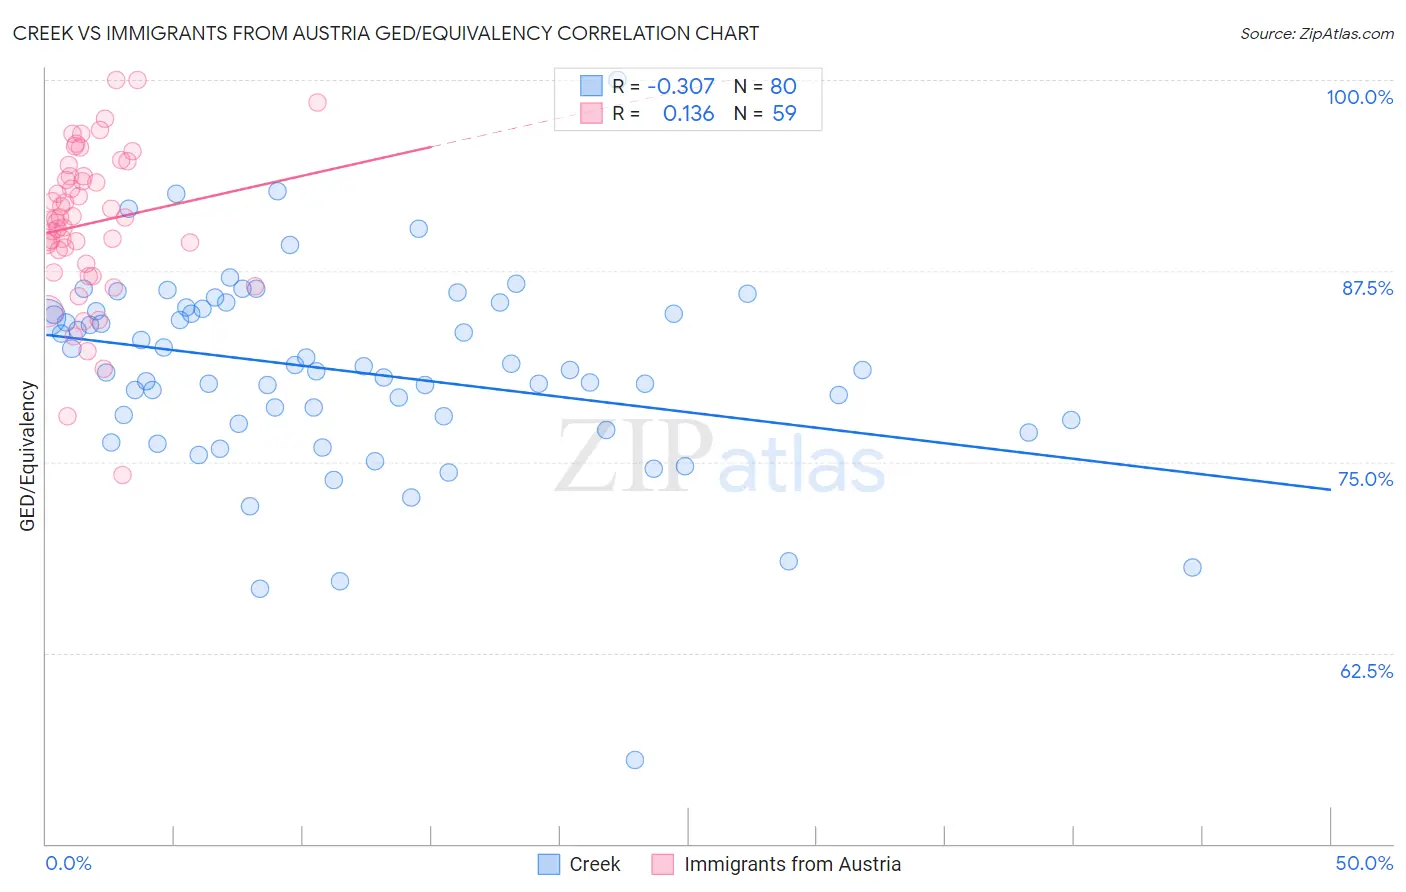
Creek vs Immigrants from Austria GED/Equivalency Correlation Chart
The statistical analysis conducted on geographies consisting of 178,480,629 people shows a mild negative correlation between the proportion of Creek and percentage of population with at least ged/equivalency education in the United States with a correlation coefficient (R) of -0.307 and weighted average of 83.6%. Similarly, the statistical analysis conducted on geographies consisting of 167,973,751 people shows a poor positive correlation between the proportion of Immigrants from Austria and percentage of population with at least ged/equivalency education in the United States with a correlation coefficient (R) of 0.136 and weighted average of 88.3%, a difference of 5.7%.
GED/Equivalency Correlation Summary
| Measurement | Creek | Immigrants from Austria |
| Minimum | 55.5% | 74.2% |
| Maximum | 100.0% | 100.0% |
| Range | 44.5% | 25.8% |
| Mean | 80.9% | 90.6% |
| Median | 81.0% | 90.9% |
| Interquartile 25% (IQ1) | 77.6% | 88.0% |
| Interquartile 75% (IQ3) | 84.9% | 93.7% |
| Interquartile Range (IQR) | 7.3% | 5.7% |
| Standard Deviation (Sample) | 6.5% | 5.0% |
| Standard Deviation (Population) | 6.5% | 5.0% |
Similar Demographics by GED/Equivalency
Demographics Similar to Creek by GED/Equivalency
In terms of ged/equivalency, the demographic groups most similar to Creek are Comanche (83.6%, a difference of 0.030%), Spanish American (83.6%, a difference of 0.090%), Bahamian (83.6%, a difference of 0.090%), Colville (83.4%, a difference of 0.17%), and African (83.4%, a difference of 0.18%).
| Demographics | Rating | Rank | GED/Equivalency |
| Immigrants | Western Africa | 1.1 /100 | #247 | Tragic 83.8% |
| Blackfeet | 1.1 /100 | #248 | Tragic 83.8% |
| Crow | 1.1 /100 | #249 | Tragic 83.8% |
| Shoshone | 1.0 /100 | #250 | Tragic 83.7% |
| Spanish Americans | 0.8 /100 | #251 | Tragic 83.6% |
| Bahamians | 0.8 /100 | #252 | Tragic 83.6% |
| Comanche | 0.7 /100 | #253 | Tragic 83.6% |
| Creek | 0.7 /100 | #254 | Tragic 83.6% |
| Colville | 0.5 /100 | #255 | Tragic 83.4% |
| Africans | 0.5 /100 | #256 | Tragic 83.4% |
| Jamaicans | 0.4 /100 | #257 | Tragic 83.3% |
| Malaysians | 0.4 /100 | #258 | Tragic 83.3% |
| Immigrants | Vietnam | 0.3 /100 | #259 | Tragic 83.2% |
| Choctaw | 0.3 /100 | #260 | Tragic 83.1% |
| Inupiat | 0.2 /100 | #261 | Tragic 83.1% |
Demographics Similar to Immigrants from Austria by GED/Equivalency
In terms of ged/equivalency, the demographic groups most similar to Immigrants from Austria are Immigrants from Belgium (88.3%, a difference of 0.030%), Burmese (88.3%, a difference of 0.030%), Immigrants from South Central Asia (88.4%, a difference of 0.050%), Immigrants from Japan (88.4%, a difference of 0.070%), and Immigrants from Sweden (88.4%, a difference of 0.080%).
| Demographics | Rating | Rank | GED/Equivalency |
| Turks | 99.8 /100 | #30 | Exceptional 88.5% |
| Bhutanese | 99.8 /100 | #31 | Exceptional 88.4% |
| Danes | 99.8 /100 | #32 | Exceptional 88.4% |
| Immigrants | Sweden | 99.7 /100 | #33 | Exceptional 88.4% |
| Immigrants | Japan | 99.7 /100 | #34 | Exceptional 88.4% |
| Immigrants | South Central Asia | 99.7 /100 | #35 | Exceptional 88.4% |
| Immigrants | Belgium | 99.7 /100 | #36 | Exceptional 88.3% |
| Immigrants | Austria | 99.7 /100 | #37 | Exceptional 88.3% |
| Burmese | 99.7 /100 | #38 | Exceptional 88.3% |
| Immigrants | Israel | 99.6 /100 | #39 | Exceptional 88.2% |
| Italians | 99.6 /100 | #40 | Exceptional 88.2% |
| Finns | 99.6 /100 | #41 | Exceptional 88.2% |
| Cambodians | 99.6 /100 | #42 | Exceptional 88.2% |
| Immigrants | Scotland | 99.6 /100 | #43 | Exceptional 88.2% |
| Macedonians | 99.5 /100 | #44 | Exceptional 88.1% |