Creek vs Somali Master's Degree
COMPARE
Creek
Somali
Master's Degree
Master's Degree Comparison
Creek
Somalis
10.5%
MASTER'S DEGREE
0.0/ 100
METRIC RATING
326th/ 347
METRIC RANK
14.2%
MASTER'S DEGREE
18.0/ 100
METRIC RATING
211th/ 347
METRIC RANK
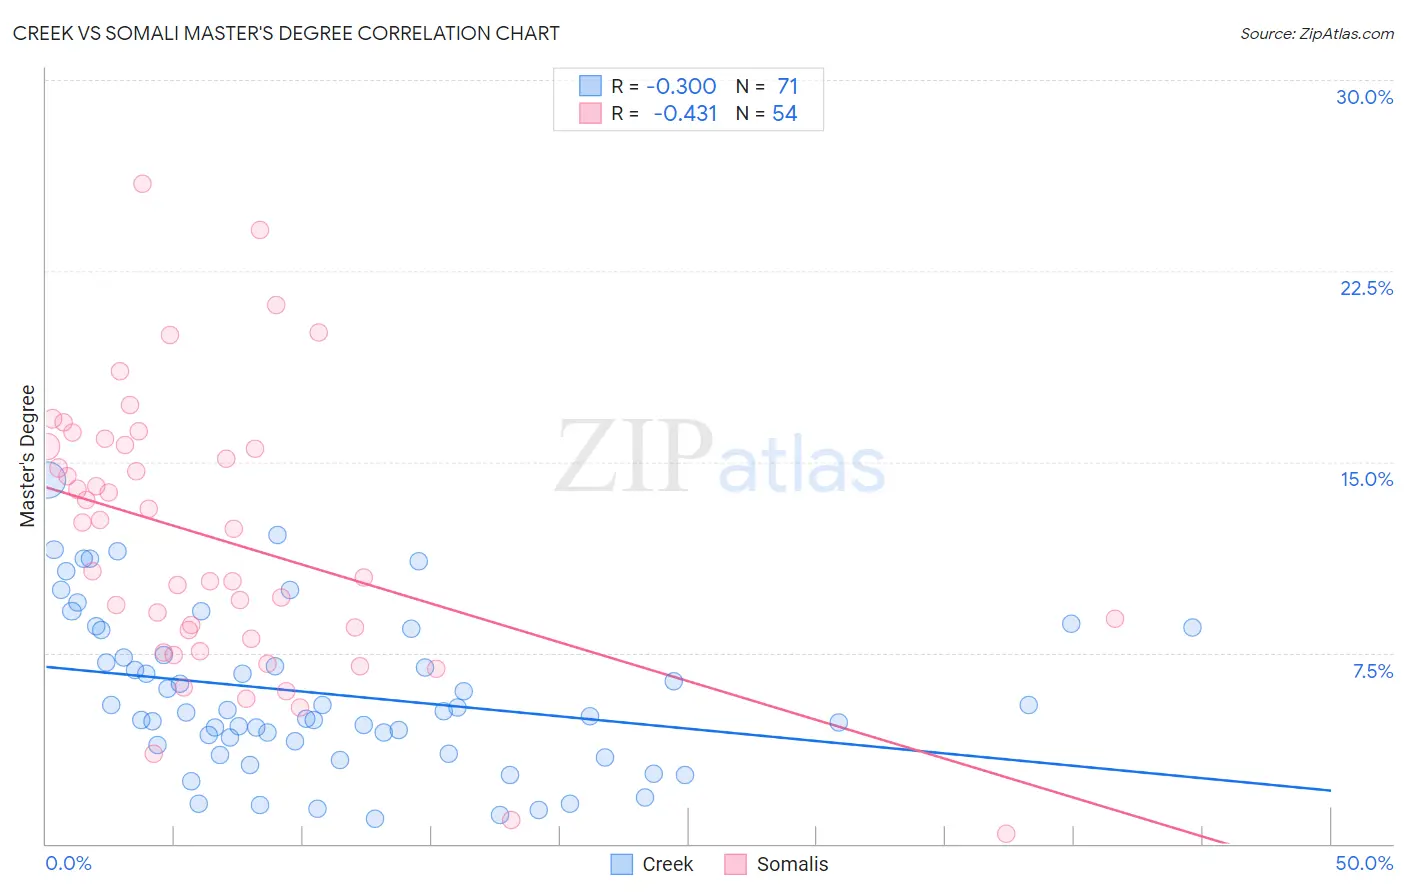
Creek vs Somali Master's Degree Correlation Chart
The statistical analysis conducted on geographies consisting of 178,384,928 people shows a weak negative correlation between the proportion of Creek and percentage of population with at least master's degree education in the United States with a correlation coefficient (R) of -0.300 and weighted average of 10.5%. Similarly, the statistical analysis conducted on geographies consisting of 99,313,729 people shows a moderate negative correlation between the proportion of Somalis and percentage of population with at least master's degree education in the United States with a correlation coefficient (R) of -0.431 and weighted average of 14.2%, a difference of 35.0%.
Master's Degree Correlation Summary
| Measurement | Creek | Somali |
| Minimum | 0.96% | 0.40% |
| Maximum | 14.3% | 25.9% |
| Range | 13.3% | 25.5% |
| Mean | 5.9% | 11.9% |
| Median | 5.2% | 11.5% |
| Interquartile 25% (IQ1) | 3.9% | 8.1% |
| Interquartile 75% (IQ3) | 8.4% | 15.6% |
| Interquartile Range (IQR) | 4.5% | 7.5% |
| Standard Deviation (Sample) | 3.1% | 5.4% |
| Standard Deviation (Population) | 3.1% | 5.3% |
Similar Demographics by Master's Degree
Demographics Similar to Creek by Master's Degree
In terms of master's degree, the demographic groups most similar to Creek are Inupiat (10.5%, a difference of 0.0%), Paiute (10.5%, a difference of 0.18%), Bangladeshi (10.5%, a difference of 0.32%), Nepalese (10.5%, a difference of 0.40%), and Dutch West Indian (10.6%, a difference of 1.1%).
| Demographics | Rating | Rank | Master's Degree |
| Kiowa | 0.0 /100 | #319 | Tragic 10.8% |
| Immigrants | Micronesia | 0.0 /100 | #320 | Tragic 10.8% |
| Pennsylvania Germans | 0.0 /100 | #321 | Tragic 10.7% |
| Sioux | 0.0 /100 | #322 | Tragic 10.7% |
| Crow | 0.0 /100 | #323 | Tragic 10.6% |
| Dutch West Indians | 0.0 /100 | #324 | Tragic 10.6% |
| Inupiat | 0.0 /100 | #325 | Tragic 10.5% |
| Creek | 0.0 /100 | #326 | Tragic 10.5% |
| Paiute | 0.0 /100 | #327 | Tragic 10.5% |
| Bangladeshis | 0.0 /100 | #328 | Tragic 10.5% |
| Nepalese | 0.0 /100 | #329 | Tragic 10.5% |
| Fijians | 0.0 /100 | #330 | Tragic 10.3% |
| Pueblo | 0.0 /100 | #331 | Tragic 10.3% |
| Immigrants | Azores | 0.0 /100 | #332 | Tragic 10.2% |
| Menominee | 0.0 /100 | #333 | Tragic 10.2% |
Demographics Similar to Somalis by Master's Degree
In terms of master's degree, the demographic groups most similar to Somalis are Spanish (14.2%, a difference of 0.050%), Immigrants from Thailand (14.2%, a difference of 0.24%), Finnish (14.2%, a difference of 0.25%), Subsaharan African (14.2%, a difference of 0.31%), and Immigrants from Panama (14.3%, a difference of 0.44%).
| Demographics | Rating | Rank | Master's Degree |
| French | 23.7 /100 | #204 | Fair 14.4% |
| Trinidadians and Tobagonians | 23.5 /100 | #205 | Fair 14.4% |
| Scandinavians | 23.3 /100 | #206 | Fair 14.4% |
| Immigrants | Bosnia and Herzegovina | 22.0 /100 | #207 | Fair 14.3% |
| Immigrants | Barbados | 20.5 /100 | #208 | Fair 14.3% |
| Immigrants | Panama | 20.0 /100 | #209 | Fair 14.3% |
| Sub-Saharan Africans | 19.4 /100 | #210 | Poor 14.2% |
| Somalis | 18.0 /100 | #211 | Poor 14.2% |
| Spanish | 17.8 /100 | #212 | Poor 14.2% |
| Immigrants | Thailand | 17.0 /100 | #213 | Poor 14.2% |
| Finns | 16.9 /100 | #214 | Poor 14.2% |
| Immigrants | Vietnam | 16.1 /100 | #215 | Poor 14.1% |
| Immigrants | Somalia | 15.8 /100 | #216 | Poor 14.1% |
| Immigrants | Trinidad and Tobago | 15.8 /100 | #217 | Poor 14.1% |
| French Canadians | 14.9 /100 | #218 | Poor 14.1% |