Comanche vs Basque Master's Degree
COMPARE
Comanche
Basque
Master's Degree
Master's Degree Comparison
Comanche
Basques
12.1%
MASTER'S DEGREE
0.3/ 100
METRIC RATING
272nd/ 347
METRIC RANK
14.7%
MASTER'S DEGREE
36.5/ 100
METRIC RATING
187th/ 347
METRIC RANK
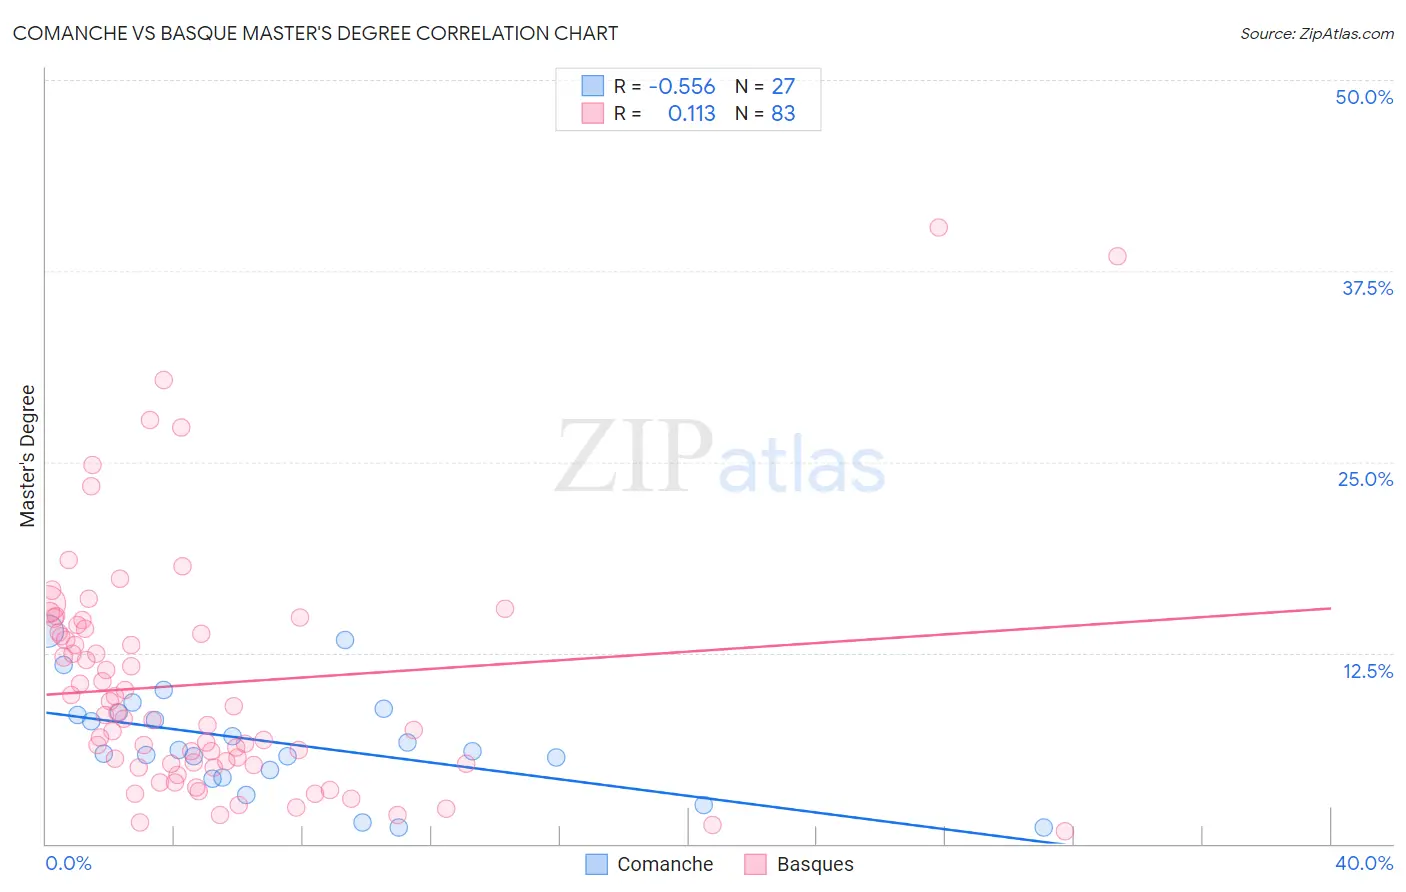
Comanche vs Basque Master's Degree Correlation Chart
The statistical analysis conducted on geographies consisting of 109,770,893 people shows a substantial negative correlation between the proportion of Comanche and percentage of population with at least master's degree education in the United States with a correlation coefficient (R) of -0.556 and weighted average of 12.1%. Similarly, the statistical analysis conducted on geographies consisting of 165,765,652 people shows a poor positive correlation between the proportion of Basques and percentage of population with at least master's degree education in the United States with a correlation coefficient (R) of 0.113 and weighted average of 14.7%, a difference of 21.1%.
Master's Degree Correlation Summary
| Measurement | Comanche | Basque |
| Minimum | 1.0% | 0.80% |
| Maximum | 13.9% | 40.4% |
| Range | 12.9% | 39.6% |
| Mean | 6.6% | 10.5% |
| Median | 6.1% | 8.4% |
| Interquartile 25% (IQ1) | 4.3% | 5.2% |
| Interquartile 75% (IQ3) | 8.6% | 14.1% |
| Interquartile Range (IQR) | 4.3% | 8.9% |
| Standard Deviation (Sample) | 3.4% | 7.8% |
| Standard Deviation (Population) | 3.3% | 7.8% |
Similar Demographics by Master's Degree
Demographics Similar to Comanche by Master's Degree
In terms of master's degree, the demographic groups most similar to Comanche are Haitian (12.1%, a difference of 0.060%), Blackfeet (12.1%, a difference of 0.090%), Cape Verdean (12.1%, a difference of 0.18%), Cuban (12.1%, a difference of 0.20%), and Black/African American (12.1%, a difference of 0.25%).
| Demographics | Rating | Rank | Master's Degree |
| Immigrants | Fiji | 0.5 /100 | #265 | Tragic 12.4% |
| Bahamians | 0.5 /100 | #266 | Tragic 12.4% |
| Americans | 0.4 /100 | #267 | Tragic 12.3% |
| Native Hawaiians | 0.4 /100 | #268 | Tragic 12.3% |
| Central Americans | 0.3 /100 | #269 | Tragic 12.2% |
| Salvadorans | 0.3 /100 | #270 | Tragic 12.2% |
| Haitians | 0.3 /100 | #271 | Tragic 12.1% |
| Comanche | 0.3 /100 | #272 | Tragic 12.1% |
| Blackfeet | 0.3 /100 | #273 | Tragic 12.1% |
| Cape Verdeans | 0.3 /100 | #274 | Tragic 12.1% |
| Cubans | 0.3 /100 | #275 | Tragic 12.1% |
| Blacks/African Americans | 0.3 /100 | #276 | Tragic 12.1% |
| Immigrants | Caribbean | 0.3 /100 | #277 | Tragic 12.1% |
| Potawatomi | 0.3 /100 | #278 | Tragic 12.1% |
| Immigrants | Belize | 0.2 /100 | #279 | Tragic 12.1% |
Demographics Similar to Basques by Master's Degree
In terms of master's degree, the demographic groups most similar to Basques are Immigrants from Costa Rica (14.7%, a difference of 0.040%), Immigrants from Oceania (14.7%, a difference of 0.080%), Immigrants (14.6%, a difference of 0.080%), Spaniard (14.6%, a difference of 0.10%), and Barbadian (14.7%, a difference of 0.24%).
| Demographics | Rating | Rank | Master's Degree |
| Celtics | 41.3 /100 | #180 | Average 14.8% |
| Swiss | 41.1 /100 | #181 | Average 14.7% |
| Czechs | 40.4 /100 | #182 | Average 14.7% |
| Sri Lankans | 39.6 /100 | #183 | Fair 14.7% |
| Immigrants | Zaire | 39.5 /100 | #184 | Fair 14.7% |
| Barbadians | 38.3 /100 | #185 | Fair 14.7% |
| Immigrants | Oceania | 37.1 /100 | #186 | Fair 14.7% |
| Basques | 36.5 /100 | #187 | Fair 14.7% |
| Immigrants | Costa Rica | 36.2 /100 | #188 | Fair 14.7% |
| Immigrants | Immigrants | 36.0 /100 | #189 | Fair 14.6% |
| Spaniards | 35.8 /100 | #190 | Fair 14.6% |
| Welsh | 34.2 /100 | #191 | Fair 14.6% |
| Immigrants | Middle Africa | 33.6 /100 | #192 | Fair 14.6% |
| Immigrants | Nigeria | 32.7 /100 | #193 | Fair 14.6% |
| Chinese | 32.5 /100 | #194 | Fair 14.6% |